New Zealand Volcano Erupts, At Risk for More
 |
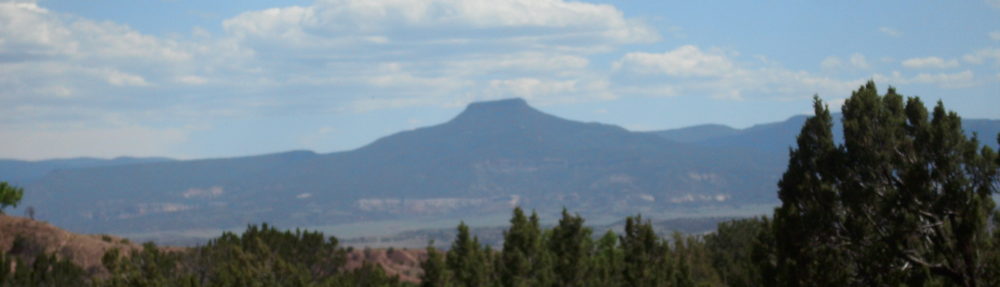
| A view of Mount Tongariro just after it erupted on Wednesday (Nov. 21). CREDIT: Via Stuff.co.nz | Lomi Schaumkel/Tamatea Intermediate School |
New Zealand’s Mount Tongariro volcano erupted for the second time this year on Wednesday (Nov. 21), sending a plume of ash 2.5 miles (4 kilometers) skyward and raising the odds that another eruption is imminent.
Tongariro, one of three active volcanoes that stand over Tongariro National Park in the heart of New Zealand’s North Island, lay dormant for more than a century before blowing open its Te Maari crater in August.
That eruption was augured by an increase in seismic activity, but Wednesday’s eruption came without any warning, said volcanologist Tony Hurst, who spoke to Radio New Zealand.
| |
| A view of Mount Tongariro just after it erupted on Wednesday (Nov. 21). CREDIT: Via Stuff.co.nz | Lomi Schaumkel/Tamatea Intermediate School |
New Zealand’s Mount Tongariro volcano erupted for the second time this year on Wednesday (Nov. 21), sending a plume of ash 2.5 miles (4 kilometers) skyward and raising the odds that another eruption is imminent.
Tongariro, one of three active volcanoes that stand over Tongariro National Park in the heart of New Zealand’s North Island, lay dormant for more than a century before blowing open its Te Maari crater in August.
That eruption was augured by an increase in seismic activity, but Wednesday’s eruption came without any warning, said volcanologist Tony Hurst, who spoke to Radio New Zealand.
There were hikers in the area at the time of the eruption, including a group of schoolchildren, but no injuries have been reported. Hurst said the eruption was relatively non-threatening because it didn’t eject many rocks, suggesting it may have originated from the same vent that had been mostly cleared out by the August eruption, which rained rocks on a hiker’s shelter a mile (1.5 km) away from the crater.
Middle school teacher Paul Lowes was hiking on Tongariro with his class when Wednesday’s 5-minute eruption began, at about 1:25 p.m. local time.
“We were sitting there celebrating with the kids, the achievement of them getting up there, and next thing, one of them pointed out, ‘Look what’s happening.’ I turned around and there [the volcano] was, just starting to blow,” Lowes told Stuff.co.nz. “We stopped in a bit of awe of it to start with, and didn’t realize what was actually happening. And as it was getting bigger, then it was sort of, ‘Right-o, it’s time to move everyone out of here.'”
Scientists had no reason to expect the eruption, but one no-warning eruption serves as a warning for the next. That’s because, historically, the Te Maari crater has had a tendency to break a silence and keep talking.
“In 1892 and 1896, it sort of had eruptive periods that went on for months with a number of different events,” Hurst told Radio New Zealand. “Having [now had] two events, it could well have more than two in this sequence. There’s an enhanced risk at the moment, certainly.”
But Tongariro is not the only potential loose cannon in the park right now. Last week, GNS Science, an official monitoring body in New Zealand and Hurst’s employer , issued a warning that Mount Ruapehu, a neighboring volcano, is showing signs that it may erupt in the coming weeks or months.
Tongariro National Park served as the backdrop of numerous scenes in the “Lord of the Rings” film trilogy, standing in for the fictional land of Mordor.
The park’s third active volcano, Mount Nguaruhoe, featured as the movies’ Mount Doom in long shots. That volcano last erupted in 1975.
from:http://www.livescience.com/24987-new-zealand-volcano-erupts-at-risk-for-more.html


