Doomsday Clock Holding

End Near? Doomsday Clock Holds at 5 ‘Til Midnight

by LiveScience Staff
Date: 14 January 2013
doomsday clock
CREDIT: Dreamstime

The hands of the infamous “Doomsday Clock” will remain firmly in their place at five minutes to midnight — symbolizing humans’ destruction — for the year 2013, scientists announced today (Jan. 14).

Keeping their outlook for the future of humanity quite dim, the group of scientists also wrote an open letter to President Barack Obama, urging him to partner with other global leaders to act on climate change.

The clock is a symbol of the threat of humanity’s imminent destruction from nuclear or biological weapons, climate change and other human-caused disasters. In making their deliberations about how to update the clock’s time this year, the Bulletin of the Atomic Scientists considered the current state of nuclear arsenals around the globe, the slow and costly recovery from events like Fukushima nuclear meltdown, and extreme weather events that fit in with a pattern of global warming.

2012 was the hottest year on record in the contiguous United States, marked by devastating drought and brutal storms,” the letter says. “These extreme events are exactly what climate models predict for an atmosphere laden with greenhouse gases.” [Doom and Gloom: 10 Post-Apocalyptic Worlds]

At the same time, the letter did give a nod to some progress, applauding the president for taking steps to “nudge the country along a more rational energy path,” with his support for wind and other renewable energy sources.

“We have as much hope for Obama’s second term in office as we did in 2010, when we moved back the hand of the Clock after his first year in office,” Robert Socolow, chair of the board that determines the clock’s position, said in a statement. “This is the year for U.S. leadership in slowing climate change and setting a path toward a world without nuclear weapons.”

The Doomsday Clock came into being in 1947 as a way for atomic scientists to warn the world of the dangers of nuclear weapons. That year, the Bulletin set the time at seven minutes to midnight, with midnight symbolizing humanity’s destruction. By 1949, it was at three minutes to midnight as the relationship between the United States and the Soviet Union deteriorated. In 1953, after the first test of the hydrogen bomb, the doomsday clock ticked to two minutes until midnight.

The Bulletin was at its most optimistic in 1991, when the Cold War thawed and the United States and Russia began cutting their arsenals. That year, the clock was set at 17 minutes to midnight.

From then until 2010, however, it was a gradual creep back toward destruction, as hopes of total nuclear disarmament vanished and threats of nuclear terrorism and climate change reared their heads. In 2010, the Bulletin found some hope in arms reduction treaties and international climate talks and bumped the minute hand of the Doomsday Clock back to six minutes from midnight from its previous post at five to midnight. But by 2012, the clock was pushed forward another minute.

from:    http://www.livescience.com/26258-doomsday-clock-5-minutes-midnight.html

2012 Volcano Report fr/Erik Klemetti

2012 Volcanic Year in Review

The submarine eruption at El Hierro continued into 2011. Image: INVOLCAN

2012, for all the hype about apocalypse, was a volcanically-quiet year. No Eyjafjallajökulls, no Puyehue-Cordon Caulles, no Pinatubos. Sure, we had some notable eruptions, but most were small-to-moderate events that, many times, won’t even end up getting preserved in the geologic record. However, that didn’t stop me from posting way too much! No, really, it was still a great year for Eruptions, with decidedly more posts about the science of volcanoes when the actual volcanic events were low. Here is the 2012 Volcanic Year in Review!


January

The start of the year got us starting to wonder about potential eruptions that might follow — including heightened alert at Lascar (that didn’t lead anywhere) and increasing activity at Popocatépetl (that sort of led somewhere). We also saw some of the last gasps of the submarine eruption at El Hierro in the Canary Islands, but as you’ll see, it hasn’t stopped the island from rumbling.

However, the media was caldera crazy to start 2012. Maybe it was just the tip of the Maya iceberg, but the Daily Mail opened January with a terrible article about the supposed immediate threat that Laacher See posed to Europe. The newspaper had to rescind the article come February. I dissected some of the conspiracy theories surrounding Yellowstone and we had some rumblings of two active caldera systems: Santorini and Long Valley.

I also tackled your questions about my 2011 post on falling into lava, I put together a gallery of images related to some of the many volcano observatories around the world and looked that the supposed danger (and younger age) of Ubehebe Crater in California.

February

Probably the biggest show in February was the fire fountains and lava flows from Etna during one of its many paroxysms of 2012. Not only are Etna’s eruptions spectacular, but they occur in a highly populated area – unlike the periodic dome growth and explosions that occur at Alaska’s remote Cleveland volcano or Pagan in the Mariana Islands. These volcanoes require satellites to watch them carefully to see activity when there is no one on the ground to notice it happening. Two volcanoes had small eruptions that looked like they could be leading to larger events, but neither Kanaga nor Rincón de la Vieja had much to show for 2012 when all was said and done.

After feeling a little jaded about all the “bad journalism” posts I had to tackle, I decided instead to look at why I love volcanoes (much more satisfying). February also brought some great vistas from above, including a shot of the island of Java and a multitude of volcanoes from space. I tried to explain how bubbles in magma lead to explosive eruptions and Dr. Shan de Silva answered your questions about Andean calderas.

I also tackled a topic that came up repeatedly during the year – the missing eruptions in the ice cap record. Namely, the ice cores suggest a large eruption in 1258 AD, but no source has been definitively identified (although inroads have been made). Another mysterious caldera eruption, the Kuwae caldera eruption in the 1450s, was also examined about whether it actually occurred.

March

Etna kept up its pace with another paroxysm to start the month, but for me, the real news was the unrest at Colombia’s Nevado del Ruiz. By the end of March, INGEOMINAS was expecting an eruption of the volcano near my mother’s hometown in “days to weeks.” Iliamna in Alaska also began to show unrest, with elevated seismicity that has persisted throughout the year.

One of the perks of my job at Denison is the field trips — and 2012 was no exception as I got to take students through some of the volcanic landforms of the Owens Valley in California, including Coso and the Long Valley caldera. I also looked at how hurricanes might influence volcanic eruptions after some research on Pinatubo and other subtropical/tropical volcanoes. March also saw the 30th anniversary of the eruption of El Chichón in Mexico – I looked back on the event and what might be in store at the volcano.

A March 23 image of Askja in Iceland, whose crater lake melted earlier than expected. Image: NASA.

April

Another month, another paroxysm at Etna. What we didn’t know then is that after April, activity at Etna would drop significantly. We had a little mystery in Iceland, where the crater lake at Askja was unexpectedly ice free months ahead of usual. Meanwhile, Nevado del Ruiz continued to rumble in Colombia. However, the most eyes were trained on Mexico’s Popocatépetl, where continued small explosions and seismicity prompted increased worry that a major eruption was brewing. However, as much as the volcano rumbled, nothing big came during 2012.

I tried to answer a question I get frequently: can humans trigger a volcanic eruption (short answer: maybe, but it would be hard and pointless). I also took on the quacks who try to sell bogus earthquake/eruption predictions (with some amusing backlash in the comments). I offered up a challenge to the earthquake prediction crowd, include the quackiest of the bunch, Piers Corbyn, but no one took me up on it.

May

Fuego in Guatemala was the headliner for May, producing its largest eruption in years. We also had ash from Nevado del Ruiz fall on cities close to the volcano like Manizales and Pereira. Other eruptions were so remote that only satellites caught the action, like the plume from Curry in the South Sandwich Islands.

Without a lot of other volcanic news during May, I looked at a pile of volcanic research, including the timing of caldera-forming eruptions at Yellowstone, volcanic lightning, the fate of all that volcanic ash, what to expect from the Baekdu Caldera in China/North Korea and how crystals can unravel the subvolcanic magmatism at active volcanoes.

June

Both Popocatépetl and Nevado del Ruiz kept on producing small eruptions as we headed into June, while Cleveland in Alaska had a explosive eruption, likely due to collapse of the dome that had been growing in the crater since earlier in the spring. We also saw the alert status raised at El Hierro in the Canary Islands for the first time in months after an intense seismic swarm occurred — but this swarm didn’t lead to any new eruption.

June marked the 100th anniversary of the largest explosive eruption of the 20th century – the famed Novarupta/Katmai eruption that produced the Valley of 10,000 Smokes. It was also the 1st anniversary of another significant eruption, the Puyehue-Cordón Caulle eruption in Chile/Argentina. Speaking of volcanically-active area, I decided to take a look at volcanism on Io and just how hot the surface of Jupiter’s inner moon might be.

July

July wasn’t too eventful on the volcanic front — but it definitely kept me on my toes after the 2012 Derecho knocked power out in Granville for 10 days. However, in volcano news, we began to get signs that Tongariro in New Zealand might be up to somethingseismic activity began to rise and volcanic gas emissions followed suit. Sakurajima, a fan favorite, also produced some of its larger explosions in the past few years.

I spent a lot of July on the road, mostly out in California doing labwork with my research student — but I did get to check out the Clear Lake area and saw some of California’s volcanic features from 30,000 feet. I also tackled why the volcanic rumblings in Colombia likely reflect more monitoring rather than more activity and how artificial volcanoes aren’t the cure-all for global warming.

A weather satellite image of the eruption plume from Tongariro in New Zealand. Image: NASA/NOAA/CIMSS

August

By the time August rolled in, it was becoming clear that 2012 was lining up to be a volcanically-quiet year (no matter what conspiracy fans tried to deny it). However, if you were in New Zealand in August, you wouldn’t have thought it was that quiet. Mere hours after I posted about the potential dangers of visiting White Island as a tourist, Tongariro had its first eruption on its main edifice in over 110 years. It turned out to be a minor, mostly steam-driven eruption. White Island also had a small explosive event to go with Tongariro’s … but that’s not all! A pumice raft was discovered in the Kermadec Islands north of New Zealand and eventually tracked back to a mid-July submarine eruption at the hitherto unrecognized seamount Havre. Sonar surveys later in the fall confirmed it as the source of the pumice raft as a new cone was imaged and all the pumice is still floating out in the western Pacific.

In other parts of the world, the Grozny Group in the Kuril Islands had a small explosive eruption while a small tephra cone was seen growing in the Buoco Nuovo crater at Etna.

September

Over the course of the fall, Nicaragua’s San Cristobal experienced eruptions large enough to prompt evacuations of people living near the volcano. Little Sitkin joined the parade of Alaskan volcanoes that showed signs of unrest, as a seismic swarm was noted at the remote volcano. We also saw ash from Anak Krakatau spread as far as 80 km from the island volcano — and I looked at how many people are displaced by volcanic activity in Indonesia. The future of Yellowstone caldera was the subject of a special paper in GSA Today (and guess what? It isn’t “end times”.)

In guest post at Lookout Landing, a blog about the Seattle Mariners, I discussed the potential volcanic threat Rainier poses to the Seattle/Tacoma area. I also took on the DOOOOOM that permeates media reports on volcano research — and lead me to write “A Media Guide to Volcanoes“.

October

I started October with one of my favorite satellite images of 2012 — a look down at the Three Sisters region in Oregon. In active volcanic events, the lava lake at the Halema’uma’u Crater on Kilauea reached a new high, while a new lava lake might have been spotted at the remote Indian Ocean volcano, Heard Island. We also saw a phreatic explosion at Poás in Costa Rica.

I talked about the great GSA Field Forum in the Sierra Nevada that I attended over at the GSA Speaking of Geoscience blog. My experiments with R produced a list of the most active volcanoes (in terms of >VEI 5 eruptions) during the last 10,000 years. I also looked at how to discuss models versus observations in science research and some fearmongering in the media over Salton Buttes and Newberry caldera. We also saw the unfortunate verdict of the l’Aquila trial in Italy, a verdict that could have ramifications in hazard monitoring for years.

The fissure vents from the late November eruption of Tolbachik. Image: KVERT.

November

November was the host to a number of eruptions, most prominently the second explosion of 2012 at New Zealand’s Tongariro. This came very soon after an alert from GNS Science about elevated temperatures at Ruapehu, Tongariro’s neighbor (and in all likelihood, a complete coincident). Volcanoes in Indonesia were as busy as ever while Santa Maria in Guatemala had some of its most vigorous activity in a while. A small plume was also spotted at Chirpoi in the Kuril Islands. However, the big action of November was just to the north of Chirpoi, on the Kamchatka Peninsula. In late November, Tolbachik, part of a complex of volcanoes that includes Bezymianny and Kliuchevskoi, had its first eruption in 36 years. It was an impressive fissure eruption that had produced lava flows that travels 10s of kilometers down the slopes of the volcano.

With all the excitement of the US Presidential election in early November, I looked at the perception of probability versus prognostication when it comes to volcanic mitigation. If you’re looking for a volcano movie to watch, I finally wrote up my guide to volcanic cinema and I described what a SHRIMP-RG is and how I use it in my research.

December

As 2012 drew to a close, we were greeted by the media frenzy about the supposed December 21 “Maya Apocalypse” and considering that you’re reading this, it is safe to say that the end of the world was not 12/21/12. The Tolbachik eruption went strong for much of the month, with some gorgeous lava flows that showed off all the textbook features we look for in these volcanic events. New Zealand’s White Island produced something that hasn’t been in any textbook: an odd looking spiky spine/dome in the central crater. We also got an impressive eruption from Ecuador’s Tungurahua and some evidence that active volcanism might be occurring on Venus. However, just as the year was coming to a close, Copahue on the Chile/Argentina surprised us with an unexpected eruption, sending a plume across southern South America. I closed out the year talking about why rocks melt on Earth — a useful thing to know if you’re into volcanoes!

So, there you have it. The Volcanic Year in Review … and hopefully 2013 will bring us more volcanic excitement.


Erik Klemetti

Erik Klemetti is an assistant professor of Geosciences at Denison University. His passion in geology is volcanoes, and he has studied them all over the world. You can follow Erik on Twitter, where you’ll get volcano news and the occasional baseball comment.

from:    http://www.wired.com/wiredscience/2013/01/2012-volcanic-year-in-review/#more-143110

Mediterranean Sea Earthquake 01/08

Earthquake in the Mediterranean Sea close to Turkey

Last update: January 8, 2013 at 3:29 pm by By

Screen Shot 2013-01-08 at 16.17.54

Update 14:49 UTC : USGS theoretical calculations are reporting a max. MMI of VII near the epicenter, but probably less on the islands. So far only a MMI V to VI has been seen which is a good sign. MMI V to MMVI (moderate to strong shaking) will lead to eventually minor damage like cracks in walls.

Update 14:46 UTC : The island of Lemnos, Greece is closest to the epicenter, but this does not mean that the strongest shaking will have been felt at Lemnos. It depends also of the propagation of the earthquake wave.  Too soon to find out, but if people living at Lemnos or close to the epicenter (radius of 40 to km) can tell us how the earthquake was felt, a lot will be clarified.

Update 14:34 UTC : ER calls this earthquake moderately dangerous for the islands in the direct area of the epicenter. Not strong enough for a tsunami. The earthquake was felt as far as Istanbul and Sofia

Update 14:25 UTC :  The earthquake struck in Mediterranean waters. Very close to Myrina island.

Update : the first preliminary reports are mentioning a M5.9 earthquake off the Turkey coast probably felt in many countries

Based on an increasing number of visitors joining us from Bulgaria, we believe that an earthquake was felt. When you are one of the people who experienced this earthquake, please fill in the form behind “I Felt A (not Listed) Earthquake”. Thank you.

Screen Shot 2013-01-08 at 15.28.08
Listen to the earthquake – Soundquakes by flyrok.org

Most important Earthquake Data:
Magnitude : Mw 5.7
UTC Time : 2013-01-08 14:16:09 UTC
Local time at epicenter : 2013-01-08 16:16:09 UTC+02:00 at epicenter
Depth (Hypocenter) : 9.9 km
Geo-location(s) :
Approx. 25 km from Lemnos, Greece
47km (29mi) WSW of Bozcaada, Turkey
67km (42mi) WSW of Ezine, Turkey
80km (50mi) NW of Mitilini, Greece
89km (55mi) SW of Canakkale, Turkey
246km (153mi) NE of Athens, Greece

for more informaitoin, go to:    http://earthquake-report.com/2013/01/08/strong-earthquake-in-the-eastern-mediterranean-sea-close-to-lemnos-and-the-turkish-coast-greece-turkey-bulgaria/

On Budding Sunspots

VERY SPOTTED SUN: Solar activity is still relatively low, but the appearance of the sun suggests the quiet might not last. Over the weekend, a profusion of new sunspot groups peppered the solar disk with dark cores–each one a potential source of eruptions. NOAA forecasters estimate a 35% chance of M-class flares and a 5% chance of X-flares during the next 24 hours. Solar flare alerts: text, voice.

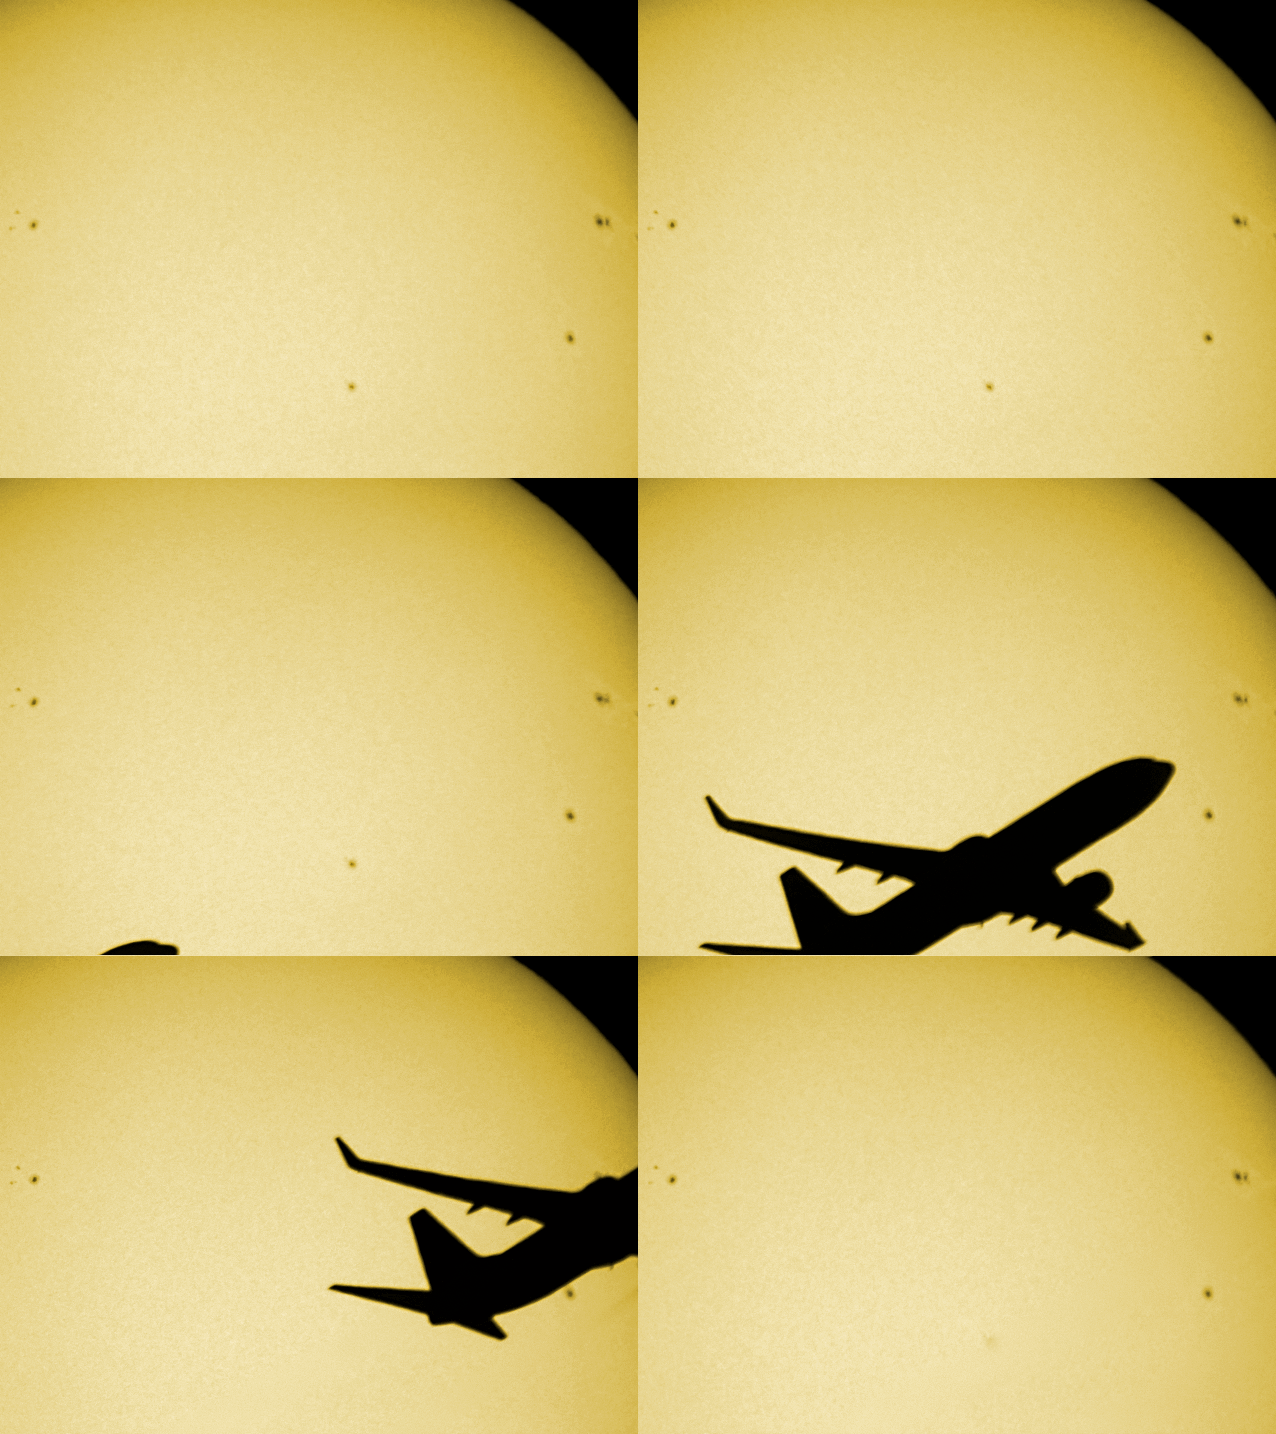
There are so many spots on the sun, even a jumbo jet cannot hide them:

Raffaello Lena took the picture on January 5 not far from the international airport in Rome, Italy. “An animation of the flyby is available here,” he says.

fr/spaceweather.com

C. Burt on Recent Weather Extremes

Snow in Mexico and Southwest Texas, Record Heat in Australia

Published: 8:49 PM GMT on January 04, 2013

Snow in Mexico and Southwest Texas, Record Heat in Australia

El Paso, Texas picked up 3.0” of snow (officially at the NWS office) on Thursday and Friday this week and heavy snow fell in the city of Chihuahua, Mexico about 200 miles south of El Paso. How unusual is this?

The answer is that it is not unusual to see snowfall in Chihuahua (or El Paso). The city of Chihuahua (pop. 840,000) rests at an altitude of 4,600’ (1,400 meters) and is one of Mexico’s coldest cities during the winter. About 2” of snow fell there on Thursday and the temperature fell to 32°F (0°C) during the duration of the snowfall between 2p.m.-6p.m. On average Chihuahua can expect one or two days of measureable snow every winter. It’s greatest snowfall on record is apparently 40 cm (about 16”) at some undisclosed date in the past.

A deep snow (about 6-8”) blanketed Chihuahua, Mexico on Christmas Eve, 2004. Such events are not as uncommon as one might suppose. Photographer unknown.

Mexico’s coldest temperature on record was also recorded in the Chihuahua State at the village of Valerio when a reading of -28.5°C (-19.3°F) was measured on January 30, 1949.

A map shows Mexico’s absolute minimum temperatures for the POR of 1941-1977 in C°. Note the large area of below zero F° (-18°C or lower) isotherms that reach far south of the border and into the Chihuahua region. The map has an apparent error so far as the -14°C isothermal line is concerned. Map from the Mexican Meteorlogical Department.

El Paso, Texas normally sees a few snowfalls every winter as well, even though it is a bit lower than Chihuahua at 3,700’ (1,140 m) but, of course, much further north. El Paso’s greatest snowfall on record was 22.4” on December 13-15, 1987 (about the same as Chicago’s record!) of which 16.8” fell in one 24-hour period. During the great cold wave of January 1962 the temperature fell to an all-time record low of -8°F (-22.2°C) on January 11th.

Some elevated suburbs of El Paso received as much as 8” from the recent storm. Ironically, the official 3” at the NWS office means that the city has now had three times more snowfall this season than Chicago, which continues its record-breaking streak of snowless weather.

Hot in Australia

All-time record highs were broken at several Australian sites in Western Australia. Red Rocks Point topped the list off with a 48.6°C (119.5°F) reading on January 3rd. Eucla, which sits right on the coast of the Great Australian Bight, measured a record 48.2°C (118.8°F). Perth had its hottest New Year’s Eve on record (and 3rd warmest December day) when the heat peaked at 42.1°C (107.8°F) on December 31st. Temperatures are forecast to exceed 45°C (113°F) today (January 4th) in portions of South Australia and New South Wales. Australia’s hottest temperature on record is 50.7°C (123.3°F) at Oodnadatta, South Australia on January 2, 1960.

Hobart, Tasmania broke its all-time heat record on Friday with a 41.8°C (107.2°F) reading. The previous record was 40.8°C (105.4°F) set in January 1976. The POR for this site in Hobart is 126 years old.

A wild fire swept through the town of Dunalley in southeast Tasmania briefly heating the weather site’s thermometer to 59.9°C (140°F) at one point Friday afternoon (at 4:22 p.m.). Winds were gusting to 82 km/h at the time.

KUDOS:Howard Rainford for Australian temperatures.

Christopher C. Burt
Weather Historian

from:    http://www.wunderground.com/blog/weatherhistorian/article.html

Major Earthquake off alaska

Potential Tsunami from M7.7 earthquake off Alaska – ALL WARNINGS and ADVISORIES are now CANCELED

Last update: January 5, 2013 at 4:57 pm by By

Earthquake overview : A major earthquake has struck off the Alaskan coast with the potential for a tsunami. Finally, no dangerous tsunami was generated but during a couple of hours people had to evacuate to higher grounds in many locations

7.4

First update – Massive earthquake in Alaska
We have just received the report that a massive 7.8 Magnitude quake struck Alaska
More details in a moment

Most important Earthquake Data:
Magnitude : M7.7
UTC Time : 5th January 2013, 08:58:19 UTC
Local time at epicenter : 4th January 2013, 23:58:19 UTC-09:00
Depth (Hypocenter) : 9.9km
Geo-location(s) : 101 km (63 miles) SW (221 degrees) of Edna Bay, AK
102 km (64 miles) W (259 degrees) of Craig, AK
106 km (66 miles) S (182 degrees) of Port Alexander, AK
314km (195mi) WNW of Prince Rupert, Canada
335km (208mi) S of Juneau, Alaska
1032 km (641 miles) NW (315 degrees) of Vancouver, British Columbia, Canada

ectonic Summary
The January 5, 2013 M 7.5 earthquake off the west coast of southeastern Alaska occurred as a result of shallow strike-slip faulting on or near the plate boundary between the Pacific and North America plates.  At the location of this earthquake, the Pacific plate is moving approximately northwestward with respect to the North America plate at a velocity of 51 mm/yr.
This earthquake is likely associated with relative motion across the Queen Charlotte fault system offshore of British Columbia, Canada, which forms the major expression of the Pacific:North America plate boundary in this region. The surrounding area of the plate boundary has hosted 8 earthquakes of magnitude 6 or greater over the past 40 years; In 1949, a M 8.1 earthquake occurred close to the Pacific:North America plate boundary approximately 230 km to the south east of the January 5th earthquake,  as a result of strike-slip faulting. In October of 2012, a M 7.8 earthquake occurred approximately 330 km to the south east of the January 5th event, slightly inboard of the plate boundary, and was associated with oblique-thrust faulting. The latter earthquake was likely an expression of the oblique component of deformation along this plate boundary system. The January 5th, 2013 earthquake is related to that Haida Gwai earthquake three months previously, and is an expression of deformation along the same plate boundary system.

Update 16:52 UTC : This earthquake was shallow, strike-slip and possible on Queen Charlotte Fault & few 100 km N of Haida Gwaii thrust quake
– We thank our many readers to send us your experiences almost immediately after the shaking stopped and before we got the official seismological data

Update 13:24 UTC : Most of the Pacific West Coast people  (USA, Alaska and Canada) have returned to their beds
– Only few of them will feel the many moderate aftershocks which will continue for many days and even weeks

Update 12:31 UTC : Most recent and normally last Tsunami bulletin for Alaska, British Columbia and the West Coast

PUBLIC TSUNAMI MESSAGE NUMBER 4 – NWS WEST COAST/ALASKA TSUNAMI WARNING CENTER PALMER AK
158 AM AKST SAT JAN 5 2013

…THE TSUNAMI WARNING IS CANCELLED…

CANCELLATIONS
————-
* THE TSUNAMI WARNING IS CANCELED FOR THE COASTAL AREAS OF BRITISH COLUMBIA AND ALASKA FROM THE NORTH TIP OF VANCOUVER ISLAND BRITISH COLUMBIA TO CAPE FAIRWEATHER ALASKA/LOCATED 80 MILES SE OF YAKUTAT/

IMPACTS – UPDATED
—————–
* A TSUNAMI WAS GENERATED DURING THIS EVENT BUT NO LONGER POSES A THREAT.
* SOME AREAS MAY CONTINUE TO SEE SMALL SEA LEVEL CHANGES.
* THE DETERMINATION TO RE-OCCUPY HAZARD ZONES MUST BE MADE BY LOCAL OFFICIALS.

RECOMMENDED ACTIONS – UPDATED
—————————–
* DO NOT RE-OCCUPY HAZARD ZONES UNTIL LOCAL EMERGENCY OFFICIALS INDICATE IT IS SAFE TO DO SO.

OBSERVATIONS OF TSUNAMI ACTIVITY – UPDATED
——————————————
TIME OBSERVED MAX  SITE OF MEASUREMENT TSUNAMI HEIGHT
—————————- ————— ————–
PORT ALEXANDER AK 1026 UTC 01-05 – 00.5FT
SITKA AK 1041 UTC 01-05 – 00.3FT

HEIGHT – OBSERVED MAX TSUNAMI HEIGHT IS THE WATER LEVEL ABOVE THE
TIDE LEVEL AT THE TIME OF MEASUREMENT.

DEEP OCEAN PRESSURE SENSORS DID NOT RECORD A TSUNAMI.

Update 11:01 UTC : GREAT NEWS :  ALL WARNINGS and ADVISORIES are now CANCELED

Update 10:44 UTC : Nothing really dramatic has happened and will probably not happen also.
Port Alexander, Alaska, sees 6-inch rise in sea level after magnitude 7.5 earthquake
Some warnings remain in effect but maybe downgraded soon :  THE COASTAL AREAS OF BRITISH COLUMBIA AND ALASKA FROM THE NORTH TIP OF VANCOUVER ISLAND BRITISH COLUMBIA TO CAPE FAIRWEATHER ALASKA/LOCATED 80 MILES SE OF YAKUTAT/

PARTLY GOOD NEWS

A NUMBER OF ADVISORY and WARNING CANCELLATIONS
-------------
* THE TSUNAMI ADVISORY IS CANCELED FOR THE COASTAL AREAS OF BRITISH COLUMBIA FROM THE WASHINGTON-BRITISH COLUMBIA BORDER TO THE NORTH TIP OF VANCOUVER ISLAND BRITISH COLUMBIA
* THE TSUNAMI WARNING IS CANCELED FOR THE COASTAL AREAS OF ALASKA FROM CAPE FAIRWEATHER ALASKA/LOCATED 80 MILES SE OF YAKUTAT/ TO CAPE SUCKLING ALASKA/LOCATED 75 MILES SE OF CORDOVA/
* THE TSUNAMI ADVISORY IS CANCELED FOR THE COASTAL AREAS OF ALASKA FROM CAPE SUCKLING ALASKA/LOCATED 75 MILES SE OF CORDOVA/ TO KENNEDY ENTRANCE ALASKA/LOCATED 40 MILES SW OF HOMER/

Update 10:18 UTC :  Some distances from the epicenter to important locations on land
106km (66mi) WSW of Craig, Alaska
304km (189mi) WNW of Prince Rupert, Canada
341km (212mi) S of Juneau, Alaska
404km (251mi) WNW of Terrace, Canada
610km (379mi) S of Whitehorse, Canada

Screen Shot 2013-01-05 at 11.55.02

…THE TSUNAMI WARNINGS REMAINS IN EFFECT…
…THE TSUNAMI ADVISORIES REMAINS IN EFFECT…

If you are a twitter user, we advise you to subscribe to our @quake_Tracker4 or one of the others. It will not only send earthquake notifications, but also I Have Felt It reports and Tsunami alerts

Update 10:08 UTC :  Good news for the broader connected Pacific / Statement for the Pacific Tsunami and weather Center :

NO TSUNAMI THREAT EXISTS FOR OTHER COASTAL AREAS IN THE PACIFIC  ALTHOUGH SOME OTHER AREAS MAY EXPERIENCE SMALL NON-DESTRUCTIVE  SEA LEVEL CHANGES LASTING UP TO SEVERAL HOURS.

Update 10:12 UTC : Tsunami advisory in effect for Prince Rupert. RCMP members going door to door and evacuating residents close to the shore.

Update 10:04 UTC : USGS has now downgraded the Magnitude from 7.7 to 7.5 with a little change in intensities but an important change for an eventual Tsunami potential

Update 09:49 UTC : A visual overview of the Tsunami a warning (red) and Tsunami advisory (orange) locations along the coast. Red means get away from the coast and walk urgently to higher grounds – Orange : be aware of strong waves and potentially higher tides

Screen Shot 2013-01-05 at 10.39.01

Update 09:34 UTC : Our main concern goes to the fisheries in case of a widespread tsunami.

for more information, go to:    http://earthquake-report.com/2013/01/05/potential-tsunami-from-m7-7-earthquake-off-alaska-warning-in-effect/
 

Earthquake off Baja California

December 14, 2012 – Strong earthquake off the coast of Southern California / Baja California

6.3 magnitude earthquake off the coast of Baja California
 Two strong earthquakes just hit far off the California – Baja  California coast, the first one being a 6.3 at a depth of 10km and 262km from land, the second one with a magnitude of 6.1 at a depth of 11 km and closer but still not dangerous distance of 142km. Both earthquakes are preliminary magnitudes. Theorical calculations from the USGS are showing that 1,735,000 people would have felt a IV shaking on the mercalli scale (light shaking) for the second earthquake, this shaking includes the cities of Rancho Palos Verdes and Long Beach, California; and a II-III (Weak shaking) for at least 9 millon people including the cities of Los Angeles, Anaheim, Santa Ana and Riverside.
This earthquakes are harmless and should create no damage, a tsunami can’t be generated.

Update: Following the earthquakes, we saw some reports coming from the USGS including a 3.5 Magnitude in Utah and a 4.2 in Southern California, those are FALSE POSITIVES this means that the earthquakes didn’t actually happen and were only a computer generated report.

142km (88mi) SW of Avalon, California
173km (107mi) SSW of Rancho Palos Verdes, California
177km (110mi) SW of San Pedro, California
179km (111mi) SSW of Palos Verdes Estates, California

Update 11:45 UTC : Max. shaking (mainly because of the depth) IV MMI at the coastal cities.

Important Update 12:05 UTC: USGS has removed the 6.1 earthquake from the charts! The 6.3M earthquake still remains but luckily this is safer as the epicenter was 262km off the coast.

Update 12:22 UTC : We will transfer the content of this article towards a special in-depth article for this earthquake. Let’s hope that the other seismic zones in the area (including the San Andreas fault) have not been influenced by the shaking waves and all remains calm the rest of the night and day.
We want to thank our many California users to send us their Experiences almost immediately after the earthquake occurred.

Update 12:26 UTC : USGS has further updated their data  to M6.3 instead of the initial M6.4

Update 12:27 UTC : We do see our Californian readers gradually returning to their beds for hopefully a shake-free night

Update 12:41 UTC : The first aftershocks are rattling the epicenter area, but due to distance from the coast people are not feeling it.

Update 13:49 UTC : After analysing the data of our EAAS (Early Earthquake Alerting System) which currently runs in the background, an alert was triggered only 3 minutes after the start of the earthquake. The system runs in testing mode at the moment and will be implemented in the site in no later than 30 to 60 days. It will work on a worldwide scale.

Update 13:54 UTC : People who have subscribed to our Regional California Only Twitter feed @Quake_TrackerCA , will not have received the M6.4 earthquake notification (the afterwards deleted M6.1 was indeed reported). After analysing the location of the epicenter, we found out that it was to the south of the region we had included. We have updated our system to also include this area as it was felt well in Southern California. We encourage our California Twitter users to tell us these things themselves via a reply to @Quake_trackerCA or by commenting in our website.

Image courtesy USGS


from:    http://earthquake-report.com/2012/12/13/major-earthquakes-list-december-14-2012/

Iran Earthquake Update

Strong extremely shallow earthquake in Iran kills at least 8 people, 23 injured and a lot of damage

Last update: December 6, 2012 at 12:47 pm by By

Earthquake overview : A seemingly moderate earthquake became a deadly one because of the specific earthquake mechanisms in Iran and because of the poor building quality.

Update Dec. 6, 12:34 UTC :

A full damage assessment has come out from Iran with the following details:-

20 villages have been damaged 60%.  (The method for Iran damage)

4 bodies have been delivered to the coroner, however, they are still waiting on 5 members of a 6 member family who presumably died when their house collapsed.

73 relief staff including 10 SAR personnel have been carrying out operations.

  • Outpatient treatment of victims: 8 people
  • The number of victims transported to the hospital: 12 people
  • Destruction of the 20 villages: 40 to 100 percent
  • The number of people resettled/evacuated to shelter: 1000 people

The following relief has been

  • Tent: 1000
  • Blankets: 600
  • Carpets: 900
  • Electric Lights: 600
  • Food and mineral water: 10000 cans.

2000 animals (livestock) are in the cold currently and there is a fear of them dying.

Update Dec. 6, 04:24 UTC : 8 people have been killed, and 1 person is missing as a result of this earthquake. 23 people have been injured with many others treated for superficial wounds.

زهان (Zohan) has seen the most damage and destruction with many houses destroyed. 5 people were killed and 1 is missing in this location. 707 people live in Zohan as of the year 2006, so this will be a great shock for the small town with 1% death rate.

15 villages in addition have been damaged/destroyed. Hosseinabad is one of those affected.

16 aftershocks between M3 and M4 have been keeping people out of their houses. It is extremely cold in South Khorasan at the moment. Around 5 degrees C overnight to 14 during the day, will mean that shelter is required.

South Khorasan is a reasonably poor region, and by the number of articles in the Iranian press about aid, this usually means that there is major damage in the villages affected.

Update Dec. 6, 21:49 UTC : For further news we will have to wait until the early morning hours in Iran. We will keep you updated.


Update 21:49 UTC : 15 emergency teams, 10 ambulances and a lot of heavy excavating equipment has been send to the epicenter area.  The weather is quit fair at the moment but temperatures go down to 3°C, thats freezing cold if you have to spend the night in open air.

Iranian SAR and relieve teams are very well organised as the country has a lot of dangerous even deadly earthquakes like this one.

Update 21:44 UTC : The epicenter of the quake was 25 kilometers (15 miles) from the town of Zohan, at a depth of nine kilometers, the Iranian Seismological Center said on its website. The quake caused damage to rural buildings and cut power lines and telephone communication. Iran has mostly adobe and brick stone houses who have a little or no resistance against earthquakes.

Update 21:03 UTC : The number of killed people remains at 5 but the number of injured has risen to at least 20.

Update 20:03 UTC : The Iranian Red Crescent is very active in trying to help the population as well as the SAR teams from the Iranian authorities.  It is currently dark in the Iran which makes relieve efforts and SAR searches extremely difficult. We will keep you updated when more news comes in.

Important update 19:45 UTC : Mehrnews Iran is reporting 4 villages very heavily damaged and  at least 5 people killed and 12 injured. A terrible result once more.

Update 17:45 UTC : Based on our experience we estimate that it will take many hours before we will get reports from the earthquake epicenter area.  The s it is dark in Iran . We are however convinced that at least minor damage may occur in an area approx. 10 to 20 km around the epicenter.

Update 17:40 UTC :  Our @Quake_tracker4 was far ahead of most other earthquake twitter accounts. Follow us and be informed as first about important earthquakes

Update 17:29 UTC : We only see a limited number of Iranian people online at the moment. The Magnitude has been lowered in the meantime to M5.6 but at an extremely shallow (and dangerous) depth of only 5.6 km.

Preliminary data are telling us a Magnitude of M6.0, but the final value can be far weaker or even higher.
Even at a Magnitude of 5.5, Iran may generate damage.

Preliminary epicenter

Most important Earthquake Data:
Magnitude : 5.6
UTC Time : 2012-12-05 17:08:12 UTC
Local time at epicenter :  2012-12-05 20:38:12 UTC+03:30 at epicenter
Depth (Hypocenter) : 5.6 km
Geo-location(s) :
43km (27mi) SE of Qayen, Iran
75km (47mi) NNE of Birjand, Iran
125km (78mi) SE of Gonabad, Iran
178km (111mi) SW of Taybad, Iran

from:    http://earthquake-report.com/2012/12/06/strong-extremely-shallow-earthquake-in-iran-kills-at-least-6-people-20-injured-and-a-lot-of-damage/


More California Storms

Wunderground Meteorologist Shaun Tanner

Posted by: Shaun Tanner, 7:04 AM GMT on December 01, 2012 +4

There has been a lot of talk and forecasting leading up to this parade of storms that were expected to hit California. And after all of the talk and prognosticating, the two storms that have already occurred have brought pretty much par-for-the-course Winter storm conditions.

Normally when a somewhat strong storm hits California during the Winter months, it brings copious amounts of rainfall to the coastal hills from the Oregon border through the hills north of San Francisco. Then, there is is a fairly tight rainfall gradient to the south, where south of the San Francisco Bay Area receives significantly less rainfall than the rest of the state. The one exception to this is in the Santa Cruz mountains. These mountains receive some of the heaviest annual rainfall in the entire state.

This is what has happened for the first two storms. A lot of rain fell north of San Francisco, with some of the higher elevations receiving upwards of 10 inches of rain on Thursday/Friday. There was so much rainfall that the typically flood-prone Russian and Navarro Rivers were threatening to burst their banks once again.

Above is the flood stage graph for the Navarro River at Navarro, CA. Note that the river went into a minor flood on Friday before quickly receding below flood stage. There is another people in that graph, and it is considerably higher. This is because another major storm is on its way and could produce some significant flooding.

Likewise, during major storms, the Russian River at Guerneville often floods. As you can see from the above graph, the river did not exceed flood stage Friday, but it is forecast to reach minor flood stage Sunday and into Monday.

Next storm set for Sunday

Saturday will be far from dry as showery weather is likely for many areas of Northern California. However, the main event will hit California Sunday with more heavy rain and possibly another 7+ inches in the higher elevations. This rain is what could put flood-prone rivers above flood stage.

You can see the HPC precipitation forecast for Sunday morning through Monday morning shows a bulls eye of rain along the western Slopes of the Sierra Nevadas. This brings up a very important story. In a normal Winter storm that hits California, rain turns to snow in the Sierra Nevadas. This snowfall represents a very important source of drinking and irrigation water for the Golden State. But, it is important that this precipitation falls as snow, staying in the mountains as a natural reservoir until the Spring, when it melts and flows into the various state’s manmade reservoirs. However, this storm will dump nearly all of this precipitation as rain. That liquid water immediately flows into the mountain rivers and down into the Central Valley. Thus, the biggest concern I personally have with this upcoming storm is the potential for flooding along the Truckee River at Truckee, CA. A Flood Warning has been issued in anticipation of flooding. The stage could reach 7.7 feet by late Sunday morning, with the potential to cause major flooding to bridges and homes along Highway 89 in Truckee.

from:    http://www.wunderground.com/blog/shauntanner/show.html?entrynum=222

Guatemala Volcanic Activity at Santa Maria

Ash Fall and Pyroclastic Flows from Guatemala’s Santa Maria

The Santiaguito dome on Santa Maria in Guatemala, showing a diffuse ash plume and a possible pyroclastic flow in the foreground. Image: Webcam capture on November 29, 2012 / INSIVUMEH.

Many of us have been watching the new eruption in Russia, but another place where volcanic activity is being felt is in Guatemala (video). Now, the Central American nation is no stranger to volcanic activity (and earthquakes as well), but currently Santa Maria is showing off some healthy ash explosions that have dusted the countryside around the volcano. Santa Maria’s might be better known to many of you as Santiaguito, the dome complex on the composite volcano. Explosions from this dome complex have been producing 1.5-3.2 km / 5000-10,000 foot ash plumes that has been spreading ash downwind and dry conditions in Guatemala has promoted extended dispersal of the ash to places that might not normally get ash fall. Eddy Sanchez of the National Institute of Seismology, Volcanology, Meteorology and Hydrology (INSIVUMEH) characterized the activity at Santa Maria as normal, but on the high side. This new ash fall has been damaging coffee, bean and sugar cane crops that are grown in the fertile soil around the volcano as well — some of which are subsistence crops for villages in the area.

You can see some of this activity on the INSIVUMEH webcam for the Santiaguito dome complex — even in the image from today, an ash plume as possible small pyroclastic flows are visible (see above).

from:    http://www.wired.com/wiredscience/eruptions/