Seismic Activity Increase in CA

Earthquake swarm on San Andreas Fault beneath Salton Sea, California

Earthquake swarm on San Andreas Fault beneath Salton Sea, California

A new earthquake swarm started beneath the Salton Sea in California on August 10, 2020. The risk of a larger earthquake over the next 7 days is considerably elevated due to the swarm when compared to background levels. The southernmost section of the San Andreas Fault is capable of rupturing in large magnitude earthquakes (M7+), the last of which occurred more than 300 years ago, USGS said.

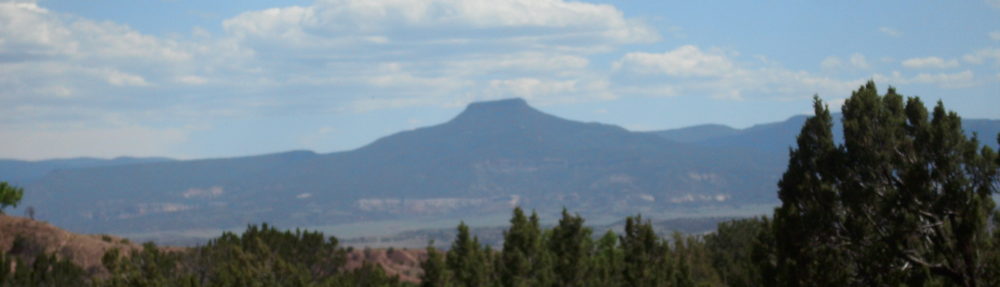
The San Andreas Fault is considered as one of the most dangerous faults in the world. It stretches around 1 200 km (750 miles) and marks the boundary between the Pacific and North American tectonic plates. There are three major cities on the fault– Los Angeles, San Francisco, and San Diego, along with other towns.

The USGS has been monitoring an ongoing earthquake activity beneath the Salton Sea near the fault, with the largest quake recorded on August 10 as M4.6.

Image credit: TW/SAM, Google

This portion of San Andreas is capable of generating tremors of M7.0 and above. The last time an earthquake of this size hit the area was over 300 years ago.

“Historically, this area has seen swarms before– most recently in 2001, 2009, and 2016.  During the last swarm in 2016, there were three bursts of activity separated by relatively quiet periods before the swarm ended,” USGS wrote.

“Past swarms in this area have remained active for 1 to 20 days, with a typical duration of about a week, so this swarm may have future bursts of activity that will in turn impact the probabilities discussed below.”

The agency warned that there are three possible scenarios of what could happen from August 12 to August 19.

The first scenario has a 98 percent chance of happening: earthquakes continue but will not be greater than M5.4 within the next week. The most likely scenario is that the rate of quakes in the swarm will decrease over the coming week.

Some moderately sized earthquakes may happen, within the range of M4.5 to M5.4. This may cause localized damage, especially in weak structures. Smaller earthquakes around M3.0 may be felt by people near the epicenters.

The second scenario has about a 2 percent chance of occurring: a larger earthquake could occur, ranging from M5.5 to 6.9. Earthquakes of this size may inflict damage around the Salton Sea area and may be followed by aftershocks that would increase the number of smaller quakes each day.

Scenario Three has less than 1 percent chance of taking place: a much bigger earthquake with M7.0 or higher could occur within the next seven days.

While the scenario has a very small probability, it would have major impacts on nearby communities if such a quake were to happen. It would be followed by aftershocks that would also increase the number of smaller shakes per day.

“No one can predict the exact time or place of any earthquake, including aftershocks or events in swarms. Our earthquake forecasts give us an understanding of the chances of having more earthquakes within a given time period in the affected area. We calculate this earthquake forecast using statistical analysis based on past earthquakes,” said USGS.

“We are carefully monitoring activity throughout the region and will continue to provide information to help people stay safe and care for themselves and each other.”

Featured image credit: USGS

from:    https://watchers.news/2020/08/12/earthquake-earthquake-swarm-at-salton-sea-near-the-san-andreas-fault-california/


Geoengineering & Drought

Data Confirms Geoengineering Is Stealing Rain From The Western US

by Dane Wigington Oct 2, 2015

Dane Wigington
Contributor, ZenGardner.com

So many forecasts for rain in the US West no longer develop. In recent years this scenario has become the rule, not the exception. The stated purpose for “solar radiation management” (SRM) is to block the sun with light scattering particles and thus to create as much atmospheric haze or cloud cover as possible (no matter how toxic that cloud cover is). Excessive atmospheric particulates cause profound disruptions to precipitation.  All too often in recent years, rain that should have fallen in the US West has consistently been blocked by two primary means, atmospheric aerosol saturation and the “ridiculously resilient ridge” of constant high pressure that has been consistently maintained over the US West. This scenario has been used to keep the Eastern US cooled down at the cost of catastrophic drought and heat in the West.

980

The engineering of the “polar vortex” cool-downs of the Eastern US was repeated again and again during the winter of 2014-2015

The eastern half of the North American continent has been the most anomalously cool zone in the entire world for almost three years. This is not due to natural variability, it is a direct result of climate engineering. Engineered snow storms are an ongoing reality and the Eastern US has been an epicenter of such weather assaults. The Chinese government openly admitted to engineering snowstorms until they did a billion dollars worth of damage to Beijing.

984

This GISS global surface temperature map reflects “departure from average high temperatures” for a two year period from 2013 to 2015. The extremely anomalous below average temperatures stand out with glaring clarity in the eastern half of rhe North American continent 

When moisture is allowed to flow over the West, it is commonly scattered by the jet aircraft aerosol spraying assault. This spraying creates too many cloud condensation nuclei (CCN). When the quantities of CCN’s are too high, moisture droplets cannot combine and fall as rain, thus the moisture just continues to migrate.

pic981

The images shown are the same, only different filters are used. The public is generally not shown any photos with enhanced infrared imaging as the clearly visible spraying would likely create great concern with the population which the power structure is trying desperately to avoid.

Geoengineering is causing catastrophic drought and fire activity. How consistently and aggressively have the climate engineers suppressed desperately needed precipitation from the US West? How much of the moisture that should have fallen in the West was blocked by engineered high pressure  domes and/or migrated over the West to the East by constant and extensive aerosol spraying? The must see 1 minute video animation below clearly illustrates with shocking clarity the effects of the scenarios just described.

Video credit: Grace Raver/ NASA’s Scientific Visualization Studio 

How catastrophic are the drought conditions in the Western US? The drought monitor map below shows conditions that are already unprecedented and getting worse by the day.

985

The current drought in California is unprecedented in at least the last 1200 years

The climate engineering crimes can only be carried out in plain site because of the total cooperation of the so called “experts” that the public relies on to tell them the truth. Weathermen are now little more than paid liars who read the scripts they are given by their paymasters in the power structure. These “forecasters” are simply compensated to cover the tracks of the geoengineers. We are told that climate engineering is for the common good and the good of the planet, this could not be further from the truth. Not only is geoengineering completely disrupting the hydrological cycle, shredding the ozone layer, and completely contaminating the entire surface of the Earth, recent science studies confirm that global geoengineering “CAN’T WORK for the stated objective of an overall planetary cooling. Geoengineering is only making an already bad climate situation far worse overall, not better. Climate engineering is about power and control, period. Make your voice heard in the effort to reach a critical mass of public awareness regarding this most dire issue.

from:    http://www.zengardner.com/data-confirms-geoengineering-stealing-rain-western-us/

California Sinking

California is sinking: Central parts of state are dropping two inches per month due to pumped-out water

The Associated Press | August 19, 2015

This July 23, 2015 photo provided by the California Department of Water Resources shows The Russell Avenue bridge, over the Delta Mendota Canal in Firebaugh, Calif.

Florence Low/ California Department of Water Resources via AP

FRESNO, Calif. Vast areas of California’s Central Valley are sinking faster than in the past as massive amounts of groundwater are pumped during the historic drought, NASA said in new research released Wednesday.

The research shows that in some places the ground is sinking nearly two inches each month, putting infrastructure on the surface at growing risk of damage.

Sinking land has occurred for decades in California because of excessive groundwater pumping during drought conditions, but the new data shows it is happening faster.

Mark Cowin, head of the California Department of Water Resources, said the costly damage has occurred to major canals that deliver water up and down the state. In addition, wells are being depleted, he said.

“Because of increased pumping, groundwater levels are reaching record lows – up to 100 feet lower than previous records,” Cowin said in a statement.

The report said land near the city of Corcoran sank 13 inches in eight months and part of the California Aqueduct sank eight inches in four months last year.

Long-term subsidence has already destroyed thousands of public and private groundwater well casings in the San Joaquin Valley. Over time, subsidence can permanently reduce the underground aquifer’s water storage capacity.

As part of an ongoing effort to respond to the effects of the drought, a task force is working with communities to develop short-term and long-term recommendations to reduce the rate of sinking and address risks to infrastructure.

“Groundwater acts as a savings account to provide supplies during drought, but the NASA report shows the consequences of excessive withdrawals as we head into the fifth year of historic drought,” Cowin said in his statement. “

The Department of Water Resources is also launching a $10 million program to help counties with stressed groundwater basins to develop or strengthen local ordinances and conservation plans.

A record low mountain snowpack has increased pumping of groundwater by farmers and other water users. Scientists used satellite images of the Earth taken over time to measure the sinking land.

from:    http://news.nationalpost.com/news/world/california-is-sinking-central-parts-of-state-are-dropping-two-inches-per-month-due-to-pumped-out-water

Dr. Masters on Yosemite Fire

California’s massive Rim Fire in Yosemite National Park continues to grow, but firefighters took advantage of less windy conditions on Tuesday and had attained 23% containment of the fire as of 9:20 am EDT on Wednesday. According to Inciweb, the Rim Fire has burned 187,000 acres. This ranks as the 7th largest fire in state history, and largest fire on record in the California Sierra Mountains, says wunderground’s weather historian, Christopher C. Burt in his latest post, “The Worst Wild Fires in U.S. History”. The Rim Fire will likely climb to be the 5th biggest fire in California’s history by this weekend, but will have difficultly surpassing California’s largest fire on record–the Cedar Fire in San Diego County of October 2003. That fire burned 273,246 acres (430 square miles), destroyed 2,820 buildings, and killed 15 people. California has had its driest year-to-date period, so it is no surprise that the state is experiencing an unusually large fire this summer. It would also not be a surprise if the state sees another huge fire this year, as peak California fire activity usually comes in September and October, during the end of the six month-long dry season, and when the hot, dry Santa Ana winds tend to blow.


Figure 1. California’s Rim Fire as captured by a member of the International Space Station on August 26, 2013. Lake Tahoe is visible at the top, and smoke from the fire obscures the northern portion of Yosemite National Park, and streams into Nevada. Image credit: NASA.


Figure 2. Outbuilding and pickup truck burned by the Rim Fire. Image credit: USFS-Mike McMillan

Weather conditions over the next five days where the Rim Fire is burning are expected to near average, with high temperatures in the upper 80s to low 90s and moderate winds. Air quality alerts for smoke have been posted over portions of California and Nevada, and Reno, Nevada is under a dense smoke advisory. The dense smoke will result in unhealthy air quality in the city, and prolonged outdoor activities are being discouraged. Travel may be difficult due to reduced visibility less than five miles on some area highways.

Links to follow
Wunderground’s weather historian, Christopher C. Burt’s latest post, “The Worst Wild Fires in U.S. History”.
Our wundermap with the fire layer turned on is a good way to track the fire perimeter and smoke plume.
Crane Flat webcam
Time lapse of the Crane Flat webcam for 8 hours on Tuesday.
Yosemite Fire Example of How Droughts Amplify Wildfires, August 26 post by Andrew Freedman of climatecentral.org

Tropical wave midway between Africa and the Lesser Antilles downgraded
A tropical wave that came off the coast of Africa on Sunday is midway between Africa and the Lesser Antilles Islands. This disturbance is moving westward at 10 – 15 mph, has a modest amount of spin, but has lost nearly all of the limited heavy thunderstorm activity it had. In their 8 am EDT Wednesday Tropical Weather Outlook, NHC downgraded the 5-day odds of formation of this disturbance from 30% to 20%. Wind shear is a moderate 10 knots over the system, but there is an area of dry air and dust from the Saharan Air Layer (SAL) to the north that is interfering with development. For the next few days, though, the wave will experience upward-moving air from a Convectively-Coupled Kelvin Wave (CCKW) that is moving eastwards across the Atlantic at 25 – 35 mph. This interaction may contribute to development. With the exception of the NAVGEM model, there is little support from the models for developing the disturbance during the next five days. The wave could spread heavy rains and gusty winds to the Lesser Antilles Islands as early as Sunday.

A tropical wave expected to emerge from the coast of Africa on Friday and track over the Cape Verde Islands is developed by the GFS and European models. This wave is expected to take a northwesterly track, and would likely not be able to make the long trek across the Atlantic to threaten North America or the Caribbean Islands.

from:    http://www.wunderground.com/blog/JeffMasters/show.html

Borrego Range, Southern California Earthquake

Strong earthquake in the Borrego range near Anza, Southern California

Last update: March 12, 2013 at 10:23 am by By

Update 18:10 UTC :  The earthquake was on the San Jacinto Fault, the most active in Southern California, said Lucy Jones, USGS science adviser for risk reduction. Aftershocks are expected.

Screen Shot 2013-03-11 at 19.19.27

Update 18:01 UTC :  Based on theoretical calculations 393,000 people will have experienced a light shaking (MMI IV) and 6.5 million people a weak to very weak shaking. Nothing special for Southern California, but the main difference in this case is that it was felt in such a huge area.

Update 17:46 UTC :  On the picture below you have a view of the desert mountain range where the earthquake struck. Except for some wildlife nobody will be around.

Anza Borrego Desert Wilderness State Park where the epicenter is -  image courtesy and copyright West Coast Sharon

Anza Borrego Desert Wilderness State Park where the epicenter is – image courtesy and copyright West Coast Sharon

Update 17:39 UTC :  Many Californians may have the same problems than we have : impossible to enter the USGS site.  The I Have Felt It Reports below will give you at least a good overview of how the people have experienced this earthquake.

Update 17:37 UTC :  Earthquake-report.com does not expect serious damage or injuries as the maximum theoretical shaking has been set to IV MMI (light shaking). This is mainly because the epicenter is in rocky mountainous area. Earthquake waves are not propagated very well in such ground.

Screen Shot 2013-03-11 at 18.57.28

Update 17:33 UTC :  The earthquake was felt from Los Angeles down to Northern Mexico (ie Mexicali). This is definitely one of the stronger earthquakes in California since the last couple of years.

Update 17:23 UTC : As you can see on our bottom map, the area had some very big earthquakes in the past.

Update 17:23 UTC : We have the impression that we are not the only ones having trouble with our servers as some USGS maps cannot be reached neither.

Update 17:20 UTC : USGS has updated his report and mentions now a M4.7 Magnitude at a depth of 12 km. 8 seconds later another one with the same Magnitude, but this may be changed again later on.

We have a hard time to write as we have too many readers in the site at the moment. Our apologies for this.
A lot of aftershocks are currently reported.
Luckily the epicenter is in a wilderness area but the valley to the east is of big concern.

Screen Shot 2013-03-11 at 18.08.14


19km (12mi) ESE of Anza, California
23km (14mi) SW of La Quinta, California
25km (16mi) SSW of Palm Desert, California
26km (16mi) SSW of Rancho Mirage, California
409km (254mi) W of Phoenix, Arizona

Most important Earthquake Data:

Magnitude : 4.7

Local Time (conversion only below land) : 2013-03-11 09:55:50

GMT/UTC Time : 2013-03-11 16:55:50

Depth (Hypocenter)  : 12.1 km

from:    http://earthquake-report.com/2013/03/11/moderate-earthquake-southern-california-on-march-11-2013/

More California Storms

Wunderground Meteorologist Shaun Tanner

Posted by: Shaun Tanner, 7:04 AM GMT on December 01, 2012 +4

There has been a lot of talk and forecasting leading up to this parade of storms that were expected to hit California. And after all of the talk and prognosticating, the two storms that have already occurred have brought pretty much par-for-the-course Winter storm conditions.

Normally when a somewhat strong storm hits California during the Winter months, it brings copious amounts of rainfall to the coastal hills from the Oregon border through the hills north of San Francisco. Then, there is is a fairly tight rainfall gradient to the south, where south of the San Francisco Bay Area receives significantly less rainfall than the rest of the state. The one exception to this is in the Santa Cruz mountains. These mountains receive some of the heaviest annual rainfall in the entire state.

This is what has happened for the first two storms. A lot of rain fell north of San Francisco, with some of the higher elevations receiving upwards of 10 inches of rain on Thursday/Friday. There was so much rainfall that the typically flood-prone Russian and Navarro Rivers were threatening to burst their banks once again.

Above is the flood stage graph for the Navarro River at Navarro, CA. Note that the river went into a minor flood on Friday before quickly receding below flood stage. There is another people in that graph, and it is considerably higher. This is because another major storm is on its way and could produce some significant flooding.

Likewise, during major storms, the Russian River at Guerneville often floods. As you can see from the above graph, the river did not exceed flood stage Friday, but it is forecast to reach minor flood stage Sunday and into Monday.

Next storm set for Sunday

Saturday will be far from dry as showery weather is likely for many areas of Northern California. However, the main event will hit California Sunday with more heavy rain and possibly another 7+ inches in the higher elevations. This rain is what could put flood-prone rivers above flood stage.

You can see the HPC precipitation forecast for Sunday morning through Monday morning shows a bulls eye of rain along the western Slopes of the Sierra Nevadas. This brings up a very important story. In a normal Winter storm that hits California, rain turns to snow in the Sierra Nevadas. This snowfall represents a very important source of drinking and irrigation water for the Golden State. But, it is important that this precipitation falls as snow, staying in the mountains as a natural reservoir until the Spring, when it melts and flows into the various state’s manmade reservoirs. However, this storm will dump nearly all of this precipitation as rain. That liquid water immediately flows into the mountain rivers and down into the Central Valley. Thus, the biggest concern I personally have with this upcoming storm is the potential for flooding along the Truckee River at Truckee, CA. A Flood Warning has been issued in anticipation of flooding. The stage could reach 7.7 feet by late Sunday morning, with the potential to cause major flooding to bridges and homes along Highway 89 in Truckee.

from:    http://www.wunderground.com/blog/shauntanner/show.html?entrynum=222

California Earthquake 10/20

Strong shallow earthquake in Central California (near King City and Greenfield)

Last update: October 21, 2012 at 3:48 pm by By

Earthquake overview : 5 minutes to midnight a strong shallow earthquake struck at close distance from King City, California. The earthquake was felt in a wide area.

Update 15:46 UTC : So far the area has been hit  by 5 aftershoks ranging from M2.5 to M3.5

Update 15:30 UTC : Until now, good news, as we have heard nothing about damages or injuries.

Update :  – The population in this region resides in structures that are highly resistant to earthquake shaking, though some vulnerable structures exist.
– Recent earthquakes in this area have caused secondary hazards such as landslides and liquefaction that might have contributed to losses

Update : The people living in King City and Greenfield are expected to have felt a moderate shaking or MMI V
29000 people will have felt a moderate shaking
194000 people a light MMI IV shaking
1.73 million people a weak to very weak shaking

Update : There are NO reports of damage

Update : The epicenter has been set at 26 km from King City, the closest significant community. The area is mainly a wilderness area.

Update : Epicenter below a wilderness area near State route 198. Closest community King City (based on preliminary data)
The earthquake occurred at 11:55 local time.

Shaking map courtesy USGS

A rather strong earthquake just occurred 60 km east of Monterey, California
Closest cities Soledad and Coalinga. In a broader view in between Monterey and Fresno, California
The preliminary Magnitude of M5.5 has been weakened to M5.1. Normally a M5.3 in California at a depth of 9.4 km may only lead to minor damage like fallen objects, cracks in walls, etc.
This is the strongest earthquake in many months in this part of California.

Most important Earthquake Data:
Magnitude : M5.3
UTC Time : 2012-10-21 06:55:09 UTC
Local time at epicenter : 2012-10-20 23:55:09 UTC-07:00 at epicenter
Depth (Hypocenter) : 9.4 km
Geo-location(s) :
26km (16mi) ENE of King City, California
34km (21mi) E of Greenfield, California
48km (30mi) WNW of Coalinga, California

from:   http://earthquake-report.com/2012/10/21/strong-shallow-earthquake-in-central-california-near-king-city-and-greenfield/

Continuing Earthquake Activity in Southern California

Earthquake swarm near Brawley, Southern California – A lot of damage + extensive update

Last update: August 27, 2012 at 9:20 pm by By

Update 15:35 UTC :
– Some pictures are showing “liquefaction” which occurs often when strong shaking takes place in sandy soil. Liquefaction occurs in saturated soils, that is, soils in which the space between individual particles is completely filled with water. This water exerts a pressure on the soil particles that influences how tightly the particles themselves are pressed together. Prior to an earthquake, the water pressure is relatively low. However, earthquake shaking can cause the water pressure to increase to the point where the soil particles can readily move with respect to each other. Liquefaction can also be compared to quicksand. Most major earthquakes have cases of liquefaction
– For American standards, this earthquake was really damaging. No collapsed houses of course, but during the 2 years of our existence, this is only the third major damaging  incident (after Virginia and Oklahoma)
– Besides some structural damage to houses and mobile homes, a lot of damage has also occurred in the interiors of the houses. The many earthquakes (more than 300) have led to many minutes of shaking (sometimes strong the very strong) and make that everything may have been ok after the first set of earthquakes but tumbled because of the many aftershocks.
– 49 patients of the Pioneer’s Memorial Hospital have been transferred throughout the area
– In addition to the Brawley Fire department, 16 other Fire corpses have given a helping hand in Brawley.
– In 1940 a M6.9 earthquake struck the Brawley area, the most important so far and contradicting yesterdays remark of a seismologist than quakes are normally not higher than +5. To the positive side one can say that the area has released his stress and that more severe quakes are unlikely to happen (although nobody is sure about that)
– Seismologists as well as the local authorities are asking people to react the best possible way on eventual new strong shaking. The main advise (which can also be found at the right side on thios page) is : Do not try to run out of buildings while shaking is occurring because you never know what is falling off the roof. Heavy shaking also means that you can be knocked down while running away. Please wait until the shaking stops before running outside.
At earthquake-report.com we continuously see that 50 to 70% is not following this advise (even in Japan). As a sad reminder we can tell you that almost all of the Lorka Spain fatalities (7) were due to falling debris while running outside!

Update 09:25 UTC :
– Aftershocks are still striking the Brawley area but a lot less than yesterday afternoon. A M3.4 is the strongest one since more than 5 hours. Although many may not sleep too well, at least the shaking will not be responsible tonight. It is currently 02:25 AM in Brawley, California.
– The following schools will be closed on Monday due to the events : Del Rio Community School, Mulberry Elementary, Brawley Union High School, Barbara Worth Junior High School, Phil D. Swing Elementary School, Miguel Hidalgo Elementary School and J.W. Oakley Elementary School
– Up to 400 people are able to spend the night in a “emergency shelter” organized by the Red Cross
– A total of 21 mobile homes have been declared uninhabitable. A lot of houses have reported minor damage.  Many trailers have been pushed of their foundations
– NO serious injuries have been reported (source : Brawley city manager)
Click here for the Local station KSWT NEWS 13 Video page

Update 06:04 UTC :
Our partner EQArchives has just finished an interactive map showing the epicenters of a big part of the swarm. Click on the image to go to the interactive map where you can zoom in and out.

Update 04:53 UTC :
– New M5.1 aftershock a few minutes ago. There has been some minor damage to old houses indicating around a intensity V-VI from the  earthquakes.
– Brawley Seismic Zone is well known for such sequences as stated before in 2005, 1981, 1970s, 1930s etc. so it should be expected that some more aftershocks / swarm earthquakes can occur in the coming hours and days.

Update 00:32 UTC :
– New M4.7 aftershock, one more of an impressive number of aftershocks
– Some trailers are simply being knocked off from their foundations
– The number of earthquakes recorded in the Imperial area must run into the hundreds (including the less than M2.5 earthquakes)

Click on the image for the normal size

Update 22:17 UTC :
Minor damage is being reported in Brawley. No houses have collapsed and we do not expect to find such damage, however some structural damage has been reported in a number of buildings. Click on the Thumbnail to watch the image in the local Imperial Valley Press

Update 22:06 UTC
– Power has been restored in some Brawley areas but not yet everywhere.
– The earthquakes were also registered on the seismographs in Los Angeles. ABC7 network has a live Quake cam on the Internet. Click here to watch it Live

Update 21:46 UTC
– The last comparable seismic swarm in Brawley dates from 1970. Another one occurred in the 1930′s
– Some buildings in Brawley were evacuated after the first stronger quakes. People will probably stay outside for a while which is good in case other even stronger quakes would strike.
– The Brawley zone is a complex seismic area of smaller faults. The San Andreas main Fault runs from near Palm Springs to enter Mexico just west of Yuma.

The video below shows the strong shaking in Brawley, California. A family is enjoying sitting together in the living room when suddenly the shaking starts (after 25 seconds)

Update 21:38 UTC
– Damage assessments are currently being executed in the Brawley area.
– Imperial County has begun operating a “County Emergency Headquarters”
– Brawley has a population of 24,953 (latest census), not a small village. The town has a significant cattle and feed industry, and hosts the annual Cattle Call Rodeo. Year-round agriculture is an important economic activity in Brawley.
– Brawley has also a Geothermal power plan

for more information and updates, go to:    http://earthquake-report.com/2012/08/26/powerful-earthquake-swarm-in-southern-california-mexico-border/

Dr. Jeff Masters on Desert Heat, Hot Rain, Tropical Developments

Hottest rain on record? Rain falls at 115°F in Needles, California
Posted by: Dr. Jeff Masters, 3:19 PM GMT on August 15, 2012 +19

A searing heat wave rare even for the Desert Southwest sent temperatures soaring to record levels on Monday, with Needles, California tying its record high for the date of 118°F (47.8°C). The temperature might have gone higher in Needles, but a thunderstorm rolled in at 3:20 pm, and by 3:56 pm PDT, rain began falling at a temperature of 115°F (46.1°C). Most of the rain evaporated, since the humidity was only 11%, and only a trace of precipitation was recorded in the rain gauge. Nevertheless, Monday’s rain at 115° in Needles sets a new world record for the hottest rain in world history. I don’t think many people were outside to experience to experience the feeling of rain falling at 115°, but if they were, it must have been an uncomfortable, sauna-like experience! Thanks go to Dr. Warren Blier of the NWS Monterey office for pointing out this remarkable event to me.

It is exceedingly rare to get rain when the temperature rises above 100°F, since those kind of temperatures usually require a high pressure system with sinking air that discourages rainfall. Monday’s rain in Needles was due to a flow of moisture coming from the south caused by the Southwest U.S. monsoon, a seasonal influx of moisture caused by the difference in temperature between the hot desert and the cooler ocean areas surrounding Mexico to the south. According to weather records researcher Maximiliano Herrera, the previous record for hottest rain, which I blogged about in June, was a rain shower at 109°F (43°C) observed in Mecca, Saudi Arabia on June 5, 2012 and in Marrakech, Morocco on July 10, 2010. The 11% humidity that accompanied Monday’s rain shower at 115° in Needles was the lowest humidity rain has ever occurred at anywhere on Earth in recorded history, according to Mr. Herrera.


Figure 1. True-color MODIS satellite image of California and Arizona taken at 1:25 pm PDT August 13, 2012. Developing thunderstorms surround Needles, CA, and the line of clouds to the southwest of the city would develop into a thunderstorm that brought rain to the city at 4 pm PDT, at a temperature of 115°F. Image credit: NASA.

A “very rare” heat wave for Phoenix
The heat wave that brought Needles’ record hot rain has broken an exceptional number of heat records in Phoenix, Arizona the past two weeks. According to the Phoenix NWS office, the “almost unbearable heat” of the first two weeks of August is a “very rare” event, and August 1 – 14, 2012 was the warmest such 2-week period in city history. The average temperature on August 6 – 13 was 100°F or higher each of the eight days, tying the record for most consecutive days with an average temperature of 100°. The temperature peaked at 116° on August 8, just 6° below Phoenix’s all-time record of 122° set on June 26, 1990. The forecast for Phoenix call for a bit of relief–highs are expected to be a relatively modest 105° today, and down near 100° by Friday.


Figure 2. Morning satellite image of 93L over the Central Atlantic.

93L close to tropical depression status
A large tropical wave (Invest 93L) is located in the Central Atlantic about 700 miles east of Bermuda. Satellite loops this morning show a surface circulation has formed, and heavy thunderstorm activity has increased to the point where 93L should be considered a tropical depression, if the heavy thunderstorms can persist through this afternoon. Wind shear is light, and ocean temperatures are warm, near 28°C. The latest Saharan Air Layer Analysis from the University of Wisconsin shows that 93L has moistened its environment considerably, and dry air should no longer be a significant impediment to development. The 8 am EDT run of the SHIPS model predicts that wind shear will remain in the low range through the weekend, and I expect this system will become Tropical Storm Gordon by Friday. The storm will not affect Bermuda, but residents of the Azores Islands should keep an eye on 93L, which could pass through the islands as early as Sunday night. In their 8 am Tropical Weather Outlook, NHC gave 93L an 80% chance of becoming a tropical depression by Friday morning.

Elsewhere in the tropics
In the Gulf of Mexico, a fall-like cold front is expected to stall out early next week, and the GFS model is predicting something could start to spin up near the Texas/Mexico border on Monday. Wind shear is predicted to be low to moderate, and cold fronts stalled out over the Gulf of Mexico often serve as the seed for tropical storms.

Most of the models predict development of a new tropical wave off the coast of Africa 6 – 7 days from now.

From:    http://www.wunderground.com/blog/JeffMasters/comment.html?entrynum=2186

Earthquake — Central California

Moderate earthquake in Central California

Last update: August 6, 2012 at 1:09 pm by By

information from:    http://earthquake-report.com/2012/08/05/major-earthquakes-list-august-6-2012/

Moderate earthquake in Central California
A moderate M4.6 earthquake (preliminary data) just occurred at 8 km from Parkfield, CA.  The epicenter is located in a wilderness area south of Coalinga (25 km from the epicenter).
USGS has recalculated the Magnitude to M4.4. Geofon (Germany) reports a 4.3 magnitude.
It must be hard to be woken up from the first part of the night (Earthquake occurred 35 minutes after midnight local time).

USGS Central California Aug 06 07:35 AM 4.5 11.6 MAP