June Weather Data

From Dr. Jeff Masters of  Wunderground:

June 2013 was the 15th warmest June in the contiguous U.S. since record keeping began in 1895, said NOAA’s National Climatic Data Center (NCDC) in their latest State of the Climate report. Six Southwest U.S. states had a top-ten warmest June on record, and no states recorded a significantly below-average June for temperatures. Over three times as many record warm highs and lows occurred than record cold highs and lows during June. For the year-to-date period January – June, both temperature and precipitation over the contiguous U.S. have been above normal, ranking in the upper 33% and 23% of years, respectively.

According to NOAA’s U.S. Climate Extremes Index (CEI), which tracks the percentage area of the contiguous U.S. experiencing top-10% and bottom-10% extremes in temperature, precipitation, and drought, June extremes were about 10% below average, and the year-to-date period January – June 2013 has been 20% below average.


Figure 1. Historical temperature ranking for the U.S. for June 2013. Six Southwest U.S. states had a top-ten warmest June on record, and no states recorded a significantly below-average June for temperatures. Image credit: National Climatic Data Center (NCDC).

Wet June on the East Coast raises hurricane flood risk
It was a very June for the contiguous U.S., ranking as the 13th wettest June since 1895. New Jersey and Delaware had their wettest June on record, and sixteen other eastern states had a top-ten wettest June. The very wet June has brought some of the highest soil moisture levels ever recorded for July along much of the coast from Florida to Maine, increasing the chances of extreme flooding should this region receive a hit from a tropical storm or hurricane during the coming peak months of hurricane season. The latest 2-week forecast from the GFS model keeps the East Coast under a wetter-than-average weather pattern into early August, and the latest 1-month and 3-month precipitation outlooks from NOAA’s Climate Prediction Center also give above-average chances of wetter than average conditions. Lake Okeechobee in Florida is 1.4′ above average for this time of year, and 5′ higher than two years ago. While this still puts the lake 1.2′ below what is considered high water, Lake Okeechobee water levels will need to be watched as we head into the peak part of hurricane season.


Figure 2. Historical precipitation ranking for the U.S. for June 2013. New Jersey and Delaware had their wettest June on record, and sixteen other eastern states had a top-ten wettest June on record. Utah had its driest June on record, and Arizona, Colorado, and Wyoming had a top-ten driest June. Image credit: National Climatic Data Center (NCDC).


Figure 3. Soil moisture for July 14, 2013, expressed as percent average of the soil moisture observed between 1916 – 2004. Portions of Florida, Georgia, South Carolina, North Carolina, Virginia, Maryland, New York, Vermont, and New Hampshire are near their highest soil moisture levels on record for this time of year, increasing the odds of extreme flooding in those states should a tropical storm or hurricane hit this year. Image credit: University of Washington Variable Infiltration Capacity Macro-scale Hydrological Model, which includes soil moisture, snow water equivalent, and runoff.

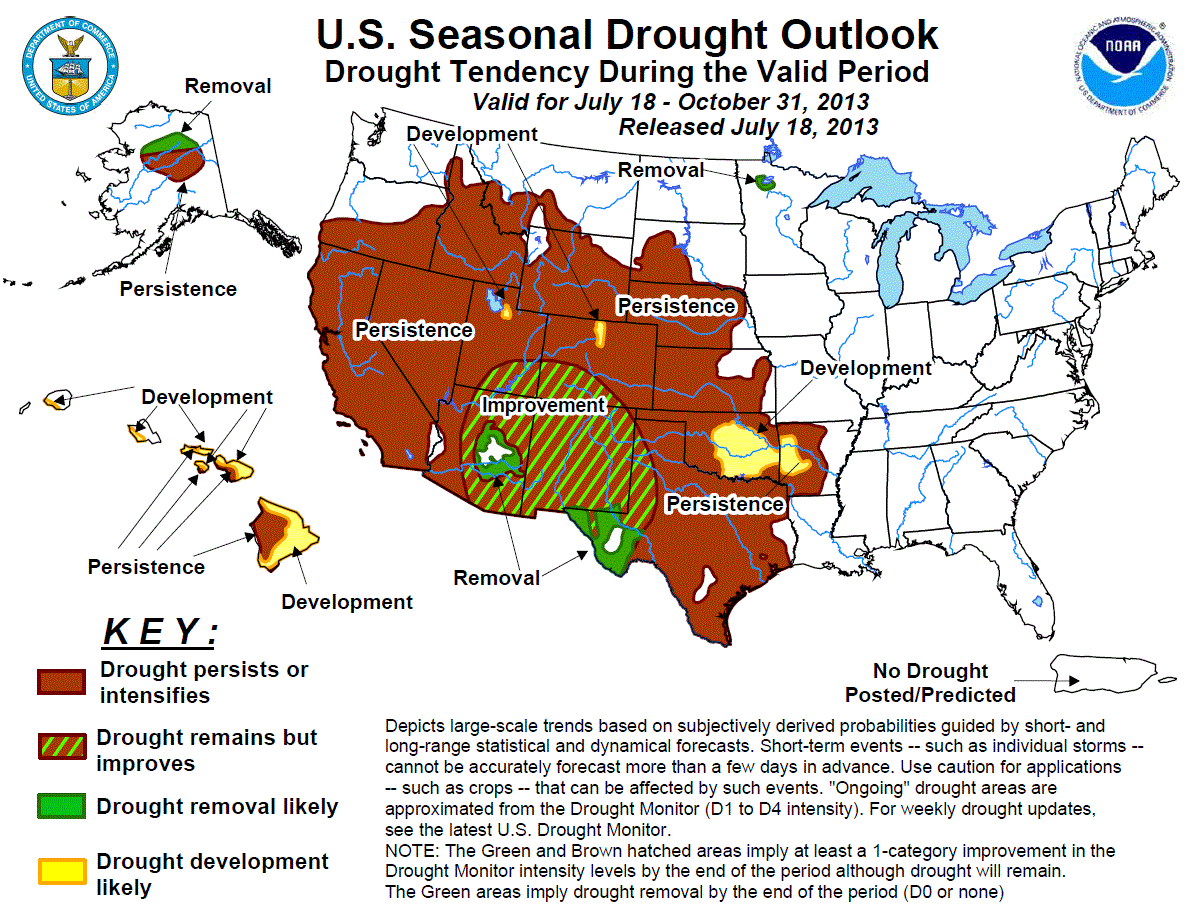
Drought conditions remained relatively unchanged during June. According to the July 9 Drought Monitor report, about 45% of the contiguous U.S. is still in moderate or greater drought, compared to 44% at the beginning of June. The U.S. Seasonal Drought Outlook issued on June 21 calls for little overall change in the U.S. area covered by drought conditions during the remainder of summer. Approximately 1.2 million acres of land burned in the U.S. during June, which is above average. However, the year-to-date total acreage burned is the second lowest in the past ten years.

Quiet in the Atlantic
There are no tropical cyclone threat areas in the Atlantic to discuss today, and none of the reliable models for tropical cyclone formation is predicting development during the coming seven days.

from:    http://www.wunderground.com/blog/JeffMasters/show.html

Albuquerque Haboob, NM Drought

Haboob Dusts New Mexico

A dust storm howled into New Mexico on the evening of June 7, 2013. We have the weather analysis, photos and video of this event below.

  1. Photos/Video/Reports

  2. Outflow Boundary @KRQEMark ? View is from NE Rio Rancho/Bernalillo about ten minutes ago. #nmwx pic.twitter.com/dl81QSeUmh
  3. 5:40PM: Amateur radio report of blowing dust reducing visibilities to 100 ft. or less along I-25 at San Felipe. #nmwx #nmroads
  4. Awesome! RT @KRQEMark: Great shot of our Haboob “Lite” by Eric. #nmwx pic.twitter.com/cZfRRNlkPj
  5. Weather Imagery

  6. Below is an animation of radar imagery from the NWS-Albuquerque from 4:35 p.m. to 6:38 p.m MDT on June 7, 2013.  The thunderstorms responsible for producing the haboob flared in the mountains near Los Alamos and Santa Fe (near the top of the animation).  Precipitation falling into a deep layer of dry air evaporates, accelerating the downdraft and outflow winds at the surface, which churns up dust.  The leading edge of the haboob, a thin, blue line of reflectivity highlighted by the yellow arrows, then raced southwestward into Albuquerque.  (Images courtesy:  Gibson Ridge/NWS-Albuquerque)
  7. As of the June 4 Drought Monitor, New Mexico is suffering the most widespread “exceptional” drought of any state in the U.S.  Almost 45% of the “Land of Enchantment” is in this worst drought category
    from:    http://www.wunderground.com/news/haboob-duststorm-albuquerque-20130608

Dr. Jeff Masters on The Drought

Late February storms put only a slight dent in U.S. drought

Published: 4:14 PM GMT on February 28, 2013
Abundant moisture from heavy rains and snows that fell during two major Midwest storms in late February put only a slight dent in the great Midwest drought of 2012 – 2013. According to the February 28, 2013 Drought Monitor, the percentage area of the contiguous U.S. suffering moderate or greater drought shrank from 56% to 54%, and the area in the worst category of drought–exceptional drought–fell from 6.7% to 5.4% over the past week. These are the largest 1-week improvements in these drought categories that we’ve seen for 9 months and 15 months, respectively. The improvements were most noteworthy in Oklahoma, the Texas Panhandle, and the Southeast U.S., where drought improved by a full category (using the level 1 to 4 categories of the Palmer Drought Severity Index.) However, the dry pattern that has been dominant over the U.S. for most of the past year will re-assert itself during the coming ten days, and most of the drought region will receive less than 0.5″ of precipitation through March 9. There exists the possibility of a significant Midwest storm on March 10, according to recent runs of the GFS and ECMWF computer models, but it is too early to assess if this storm may be able to provide significant drought relief. In general, droughts are more likely in the Midwest U.S. when warmer than average ocean temperatures prevail in the tropical Atlantic, with cooler than average ocean temperatures in the tropical Eastern Pacific (La Niña-like conditions.) This is what we had in during most of 2012, and continue to have in 2013. Equatorial East Pacific ocean temperatures are currently 0.5°C below average. This is similar to the ocean temperatures seen in the spring of 2012, just before the Great Drought of 2012 began. Most of the U.S. drought region needs 3 – 9″ of precipitation to pull out of drought. Unless the Midwest receives a top-ten percent wettest spring on record, drought is going to be a huge concern as we enter summer.


Figure 1. Drought conditions as of February 28, 2013 showed that drought still gripped a majority of the U.S. Image credit: U.S. Drought Monitor.


Figure 2. Predicted 7-day precipitation for the period ending Thursday, March 7. Less than 10% of the U.S. drought regions are predicted to receive as much as 0.5″ of precipitation (dark green color.) Image credit: NOAA/HPC.

Jeff Masters

from:    http://www.wunderground.com/blog/JeffMasters/article.html

Dr. Jeff Masters Compares 2012 Drought to Dust Bowl Days

Comparing the 2012 drought to the Dust Bowl droughts of the 1930s
Posted by: Dr. Jeff Masters, 4:52 PM GMT on August 16, 2012 +12

The great U.S. drought of 2012 remained about the same size and intensity over the past week, said NOAA in their weekly U.S. Drought Monitor report issued Thursday, August 16. The area of the contiguous U.S. covered by drought remained constant at 62%, and the area covered by severe or greater drought also remained constant at 46%. However, the area covered by the highest level of drought–exceptional–increased by 50%, from 4% to 6%. Large expansions of exceptional drought occurred over the heart of America’s grain producing areas, in Kansas, Nebraska, Oklahoma, and Missouri. The new NOAA State of the Climate Drought report for July 2012 shows that the 2012 drought is 5th greatest in U.S. history, and the worst in 56 years. The top five years for area of the contiguous U.S. covered by moderate or greater drought:

1) Jul 1934, 80%
2) Dec 1939, 60%
3) Jul 1954, 60%
4) Dec 1956, 58%
5) Jul 2012, 57%

The top five years for the area of the contiguous U.S. covered by severe or greater drought:

1) Jul 1934, 63%
2) Sep 1954, 50%
3) Dec 1956, 46%
4) Aug 1936, 43%
5) Jul 2012, 38%


Figure 1. August 14, 2012 drought conditions showed historic levels of drought across the U.S., with 62% of the contiguous U.S. experiencing moderate or greater drought, and 46% of the county experiencing severe or greater drought. Image credit: U.S. Drought Monitor.

Comparison with the great Dust Bowl droughts of the 1930s
An important fact to remember is that the 2012 drought is–so far–only a one-year drought. Recall that 2011 saw record rains that led to unprecedented flooding on the Mississippi, Ohio, and Missouri Rivers. In contrast, the great droughts of the 1950s and 1930s were multi-year droughts. The Dust Bowl drought of the 1930s lasted up to eight years in some places, with the peak years being 1934, 1936, and 1939 – 1940. Once the deep soil dries out, it maintains a memory of past drought years. This makes is easier to have a string of severe drought years. Since the deep soil this summer still maintains the memory of the very wet year of 2011, the 2012 drought will be easier to break than the Dust Bowl droughts of the 1930s were.

In addition, a repeat of the dust storms of the 1930s Dust Bowl is much less likely now, due to improved farming practices. In a 2009 paper titled, Amplification of the North American “Dust Bowl” drought through human-induced land degradation, a team of scientists led by Benjamin Cook of the Lamont-Doherty Earth Observatory explained the situation:

During the 1920s, agriculture in the United States expanded into the central Great Plains. Much of the original, drought-resistant prairie grass was replaced with drought-sensitive wheat. With no drought plan and few erosion-control measures in place, this led to large-scale crop failures at the initiation of the drought, leaving fields devegetated and barren, exposing easily eroded soil to the winds. This was the source of the major dust storms and atmospheric dust loading of the period on a level unprecedented in the historical record.


Figure 2. Black Sunday: On April 14, 1935 a “Black Blizzard” hit Oklahoma and Texas with 60 mph winds, sweeping up topsoil loosened by the great Dust Bowl drought that began in 1934.

The Dust Bowl drought and heat of the 1930s: partially human-caused
Using computer models of the climate, the scientists found that the Dust Bowl drought was primarily caused by below-average ocean temperatures in the tropical Pacific and warmer than average ocean temperatures in the Atlantic, which acted together to alter the path of the jet stream and bring fewer precipitation-bearing storms to the Central U.S. However, the full intensity of the drought and its spatial extent could not be explained by ocean temperature patterns alone. Only when their model included the impact of losing huge amounts of vegetation in the Plains due to poor farming practices could the full warmth of the 1930s be simulated. In addition, only by including the impact of the dust kicked up by the great dust storms of the Dust Bowl, which blocked sunlight and created high pressure zones of sinking air that discouraged precipitation, could the very low levels of precipitation be explained. The Dust Bowl drought had natural roots, but human-caused effects made the drought worse and longer-lasting. The fact that we are experiencing a drought in 2012 comparable to the great Dust Bowl drought of the 1930s–without poor farming practices being partially to blame–bodes ill for the future of drought in the U.S. With human-caused global warming expected to greatly increase the intensity and frequency of great droughts like the 2012 drought in coming decades, we can expect drought to cause an increasing amount of damage and economic hardship for the U.S. Since the U.S. is the world’s largest food exporter, this will also create an increasing amount of hardship and unrest in developing countries that rely on food imports.

from:    http://www.wunderground.com/blog/JeffMasters/comment.html?entrynum=2188

Drought Devastates Corn Yield, Affects Food Prices

U.S. Corn Production Outlook Cut As Drought Takes Toll

AP  |  By Posted: 08/10/2012 9:34 am Updated: 08/10/2012 11:02 am

ST. LOUIS (AP) — The government slashed its expectations for U.S. corn and soybean production for the second consecutive month Friday, predicting what could be the lowest average corn yield in more than 15 years as the worst drought in decades continued punishing key farm states.

Nonetheless, Agriculture Secretary Tom Vilsack, in a statement supplied exclusively to The Associated Press, insisted that U.S. farmers and ranchers remain resilient and that the country would continue to meet demand as the global leader in farm exports and food aid.

The U.S. Agriculture Department cut its projected U.S. corn production to 10.8 billion bushels, down 17 percent from its forecast last month of nearly 13 billion bushels and 13 percent lower than last year. That also would be the lowest production since 2006.

The USDA, in its monthly World Agricultural Supply and Demand Estimates report, now expects corn growers to average 123.4 bushels per acre, down 24 bushels from last year in what would be the lowest average yield in 17 years.

Soybean production is now forecast at 2.69 billion bushels, a 12 percent decline from last year and well off the 3.05 billion bushels the USDA had expected last month. Expected yields on average of 36.1 bushels per acre would be the lowest since 2003.

Friday’s revised outlook comes months after corn farmers forecast a record year when they planted, sowing 96.4 million acres — the most since 1937. But the USDA now forecasts the area to be harvested at 87.4 million acres.

On Thursday, the U.N. food agency drew a direct correlation between price hikes in basic food commodities and the months of parched conditions in farm states. The Rome-based Food and Agriculture Organization said in its monthly price report that its overall food price index climbed 6 percentage points in July, although it was well below the peak reached in February 2011. The FAO’s index, considered a global benchmark used to track market volatility and price trends, measures the monthly price changes for a basket of food items including cereals, oils and fats, meat, dairy products and sugar.Severe drought punishing the U.S.’s midsection has sent corn prices soaring, and expectations of worsened crop prospects in Russia because of dry weather sent world wheat prices up 19 percent, according to the FAO, which keeps close tabs on volatile global prices. Spikes in the prices of staple foods have led to riots in some countries in recent years.

But on Friday, Vilsack tried to tamp down such concerns.

“Americans shouldn’t see immediate increases in food prices due to the drought,” said Vilsack, as he visited drought-stricken Nebraska and with plans to be in Iowa next week. “What is important going forward is that we continue to do all we can to help the farmers, ranchers, small businesses and communities being impacted by this drought.”

Rick Whitacre, a professor of agricultural economics at Illinois State University, said consumers may see modest increases in prices in grocery stores due to tightened corn supplies because the grain is so ubiquitous, found in everything from cosmetics to cereal, soda, cake mixes and candy bars. But he believes the bigger fallout will come in 4 to 6 percent price increases for beef and pork, with many ranchers having sold off their livestock as feed costs rise and the drought burned up their pasturelands.

“You’re going to see the ripple of this go out for quite a distance,” Whitacre said. “We may see some upward pressure (on prices), especially in things like vegetable oil and a lot of our food products,” but that should be manageable.

The U.S. leads the world in exporting corn, soybeans and wheat, and the surging prices are expected to be felt across the international marketplace, hurting poor food-importing countries, said a study by British charity Oxfam issued on the eve of the U.N. report.

Vilsack said he has pressed Congress to pass a comprehensive, multi-year farm bill “that gives farmers and ranchers more certainty in this tough time, while giving USDA tools to help those producers affected by weather-related events beyond their control.”

The USDA foreshadowed the newly lowered yield projections, noting earlier this week that exactly half of the nation’s corn crop was rated poor to very poor, up 2 percentage points from the previous week and creeping closer to the peak of 53 percent of 24 years ago. Some 39 percent of soybeans now fall under those two categories, rising 2 percentage points for the second straight week and eclipsing the 1988 benchmark of 37 percent.

The nation’s rangeland and pastures are faring even worse, with roughly three-fifths rated to be in poor to very poor shape — the largest area thus affected in 18 years.

Friday’s USDA report amplified the troubling picture painted a day earlier when the latest weekly U.S. Drought Monitor map showed that the drought conditions continue to worsen in Plains states, where production of corn and soybeans is key. That update showed that the expanse still gripped by extreme or exceptional drought — the two worst classifications — rose to 24.14 percent, up nearly 2 percentage points from the previous week.

Federal scientists say this July was the hottest on record, smoking out even the sweltering temperatures set in the Dust Bowl in the 1930s. The National Oceanic and Atmospheric Administration reported Wednesday that the first seven months of 2012 were the warmest on record while the stretch from August 2011 through July this year was the balmiest 12-month period the U.S. has experienced.

http://www.huffingtonpost.com/2012/08/10/us-corn-production_n_1763943.html

FIsh Dying as Waters Heat Up with Record Temps

Thousands of Dead Fish Wash Ashore As Midwest Waters Heat Up

Posted By on Aug 7th, 2012

Thousands of dead fish Common carp (Cyprinus carpio). Public domain image from USFWS National Image Library. Created by Duane Rave

Thousands of dead fish Common carp (Cyprinus carpio). Public domain image from USFWS National Image Library. Created by Duane Rave

Thousands of Fish Die in Midwest Heat

As the Midwestern United States suffers from the worst drought combined with searing temperatures in 50 years, thousands of dead fish are turning up in lakes and rivers as water temperatures rise to almost 100 degrees, reports ABC News.

“It’s something I’ve never seen in my career, and I’ve been here for more than 17 years,” said Mark Flammang, a fisheries biologist with the Iowa Department of Natural Resources. “I think what we’re mainly dealing with here are the extremely low flows and this unparalleled heat.”

One of the worst cases of fish killed occured in Iowa when water temperatures reached 97 degrees, hot enough to kill more than 40,000 shovelnose sturgeon.

State officials commented that they have never seen such a massive die off of sea creatures in the last 20 years.

The massive die-off has caused a loss of $10 million to the state since the sturgeon are a prime source of caviar produced from their eggs.

Thousands of bass and catfish have likewise turned up dead in rivers in Illinois, with several endangered species threatened with extinction, including the greater redhorse fish in Illinois and the pallid sturgeon in Nebraska.

Flammang said since July, more than 3,000 existing heat records have been broken throughout the Midwest and forecasters can’t predict when the devastating heat and drought will end.

“Those fish have been in these rivers for thousands of thousands of years, and they’re accustomed to all sorts of weather conditions,” he said. “But sometimes, you have conditions occur that are outside their realm of tolerance.”

The following facts compiled by the AP give a good picture of just how bad things are:

• Iowa DNR officials said the sturgeon found dead in the Des Moines River were worth nearly $10 million, a high value based in part on their highly sought eggs, which are used for caviar.

• The federal U.S. Drought Monitor shows nearly two-thirds of the lower 48 states are experiencing some form of drought.

• The Department of Agriculture has declared more than half of the nation’s counties — nearly 1,600 in 32 states — as natural disaster areas.

• More than 3,000 heat records were broken over the last month.

from:    http://www.dbtechno.com/us/2012/08/07/thousands-of-dead-fish-as-midwest-waters-heat-up/?utm_source=scribol.com&utm_medium=referral&utm_campaign=scribol.com

Drought Now Affects 56% of US

Drought Reaches Record 56% of Continental US

Jeanna Bryner, LiveScience Managing Editor
Date: 05 July 2012
dry lake bed

The Southwest may be stuck with more scenes like this dry lake bed.
CREDIT: NOAA.

The United States is parched, with more than half of the land area in the lower 48 states experiencing moderate to extreme drought, according to a report released today (July 5).

Just under 56 percent of the contiguous United States is in drought conditions, the most extensive area in the 12-year history of the U.S. Drought Monitor. The previous drought records occurred on Aug. 26, 2003, when 54.79 percent of the lower 48 were in drought and on Sept 10, 2002, when drought extended across 54.63 percent of this area.

When including the entire nation, the monitor found 46.84 percent of the land area meets criteria for various stages of drought, up from 42.8 percent last week. Previous records: 45.87 percent in drought on Aug. 26, 2003, and 45.64 percent on Sept. 10, 2002.

The recent heat and dryness is catching up with us on a national scale,” Michael Hayes, director of the National Drought Mitigation Center at the University of Nebraska-Lincoln, said in a statement. “Now, we have a larger section of the country in these lesser categories of drought than we’ve previously experienced” in the past 12 years.

The monitor uses a ranking system that goes from D0 (abnormal dryness) to D1 (moderate drought), D2 (severe drought), D3 (extreme drought) and D4 (exceptional drought).

At the lower end of the scale, moderate drought involves some damage to crops and pastures, and low water levels in streams, reservoirs or wells. Areas in exceptional drought would experience widespread crop and pasture losses and water shortages that lead to water emergencies. Currently, 8.64 percent of the country would meet criteria for either extreme or exceptional drought.

“During 2002 and 2003, there were several very significant droughts taking place that had a much greater areal coverage of the more severe and extreme drought categories,” Hayes said. “Right now we are seeing pockets of more severe drought, but it is spread out over different parts of the country.

“It’s early in the season, though. The potential development is something we will be watching,” he added.

Further into the past, the United States has experienced some really serious droughts, including one in the 1930s, the Dust Bowl drought, and another in the 1950s, each of which lasted five to seven years and covered large swaths of the continental United States. Droughts are one of the most costly weather-related events in terms of economics and loss of life, according to the National Oceanic and Atmospheric Administration (NOAA). Between 1980 and today, 16 drought events cost $210 billion, according to a recent report.

While no single event like this year’s extensive drought can be said to be the result of global warming, scientists say more extreme weather should be expected as the planet warms, according to a report compiled by the Intergovernmental Panel on Climate Change (IPCC) in 2011. That year, there were 12 $1-billion disasters.

In particular, the report authors predicted that with climate change there would be an increase in certain types of extreme weather, including daily high temperatures, heat waves, heavy precipitation and droughts, in some places.

The U.S. Drought Monitor is a joint endeavor by the National Drought Mitigation Center, NOAA, the U.S. Department of Agriculture and drought observers across the country.

from:    http://www.livescience.com/21419-drought-record-weather.html

And the Heat Goes On

The June 2012 U.S. heat wave: one of the greatest in recorded history
Posted by: Dr. Jeff Masters, 7:34 PM GMT on July 03, 2012 +35

Intense heat continues to bake a large portion of the U.S. this Tuesday, with portions of 17 states under heat advisories for dangerously high temperatures. The heat is particularly dangerous for the 1.4 million people still without power and air conditioning due to Friday’s incredible derecho event, which is now being blamed for 23 deaths. The ongoing heat wave is one of the most intense and widespread in U.S. history, according to wunderground’s weather historian, Christopher C. Burt. In his Sunday post, The Amazing June Heat Wave of 2012 Part 2: The Midwest and Southeast June 28-30, Mr. Burt documents that eighteen of the 298 locations (6%) that he follows closely because of their long period of record and representation of U.S. climate broke or tied their all-time heat records during the past week, and that “this is especially extraordinary since they have occurred in June rather than July or August when 95% of the previous all-time heat records have been set for this part of the country.” The only year with more all-time heat records than 2012 is 1936, when 61 cities of the 298 locations (20%) set all-time heat records. The summer of 1936 was the hottest summer in U.S. history, and July 1936 was the hottest month in U.S. history.

According to wunderground analysis of the National Climatic Data Center (NCDC) extremes database, during June 2012, 11% of the country’s 777 weather stations with a period of record of a century or more broke or tied all-time heat records for the month of June. Only 1936 (13% of June records broken or tied) and 1988 (12.5%) had a greater number of all-time monthly June records. I expect when NCDC releases their analysis of the June 2012 weather next week, they will rank the month as one of the top five hottest Junes in U.S. history.


Figure 1. Across the entire Continental U.S., 72% of the land area was classified as being in dry or drought conditions as of June 26, 2012. Conditions are not expected to improve much over the summer: the NOAA Climate Prediction Center’s latest drought outlook shows much of the U.S. in persistent drought conditions, with very few areas improving. The rains brought by Tropical Storm Debby did help out Florida and Georgia, however. Image credit: NOAA Environmental Visualization Laboratory.

The forecast: hot and dry
July is traditionally the hottest month of the year, and July 2012 is likely to set more all-time heat records. The latest predictions from the GFS and ECMWF models show that a ridge of high pressure and dry conditions will dominate the weather over about 80 – 90% of the country during the next two weeks, except for the Pacific Northwest and New England. This will bring wicked hot conditions to most of the nation, but no all-time heat records are likely to fall. However, around July 11, a sharp ridge of high pressure is expected to build in over the Western U.S., bringing the potential for crazy-hot conditions capable of toppling all-time heat records in many western states.

The intense heat and lack of rain, combined with soils that dried out early in the year due to lack of snowfall, have led to widespread areas of moderate to extreme drought over much of the nation’s grain growing regions, from Kansas to Indiana. The USDA is reporting steadily deteriorating crop conditions for corn and soybeans, and it is likely that a multi-billion dollar drought disaster is underway in the Midwest.

The wunderground Extremes page has an interactive map that allows one to look at the records for the 298 U.S. cities that Mr. Burt tracks. Click on the “Wunderground U.S. Records” button to see them.

Quiet in the Atlantic
There are no threat areas to discuss in the Atlantic, and none of the reliable computer models are developing a tropical cyclone over the next seven days.

Have a great 4th of July holiday, everyone, and I’ll be back Thursday with a new post.

Jeff Masters

fr/    http://www.wunderground.com/blog/JeffMasters/comment.html?entrynum=2144

Dr. Jeff Masters on Hurricanes & Tropical Storms

Today is my last day in Ponte Vedra Beach, Florida, where 700 of the world’s hurricane experts are gathered to attend the 30th Conference on Hurricanes and Tropical Meteorology of the American Meteorological Society. It’s been a great week of learning and catching up with old friends, and I present below a few final summaries of talks I attended.

Impact of Tropical Cyclones on drought alleviation in the Atlantic and Gulf Coasts
Dr. Pat Fitzpatrick of the Stennis Space Center in Mississippi discussed how landfalling tropical storms and hurricanes can alleviate drought. The biggest winner tends to be the Southeast U.S. states of Florida, Georgia, South Carolina, and North Carolina, where about 20% – 50% of all droughts between 1960 – 2009 were busted by a landfalling tropical storm or hurricane. It is uncommon for Texas to see a drought busted; less than 10% of all Texas droughts have been ended by a hurricane or tropical storm. This occurs because the Southeast U.S. can receive heavy rains from hurricanes moving up the East Coast, or moving through the Gulf of Mexico, while relatively few storms track over Texas. Over the course of a year, hurricanes and tropical storms contribute 15 – 20% of rain along the Gulf Coast, and 3 – 16% along the East Coast. The length of a drought does not seem to affect whether a drought can be ended by a hurricane or not. Hurricanes have been able to end both short (< 3 month) and long (> 12 month droughts) equally well.


Figure 1. Example of a drought-busting tropical storm. Moderate drought (Palmer Drought Severity Index, PDSI, ≤ –2.0) was present in 52 percent of the Florida, Georgia, South Carolina, and North Carolina climate divisions in May 2006. The percentage decreased to 29 percent after Tropical Storm Alberto passed through on June 11 – 15, 2006. Image credit: U.S. Drought Monitor.


Figure 2. Rainfall in inches from the passage of Tropical Storm Alberto in 2006. Image credit: NOAA/HPC.

According to the U.S. drought monitor, over 90% of the area of Florida, Georgia, South Carolina, and North Carolina are currently in moderate to exceptional drought. There is 1 – 2 inches of rain coming to much of the region over the next few days, but that will not be enough to bust the drought. Based on Dr. Fitzpatrick’s research, there is a 20% – 50% chance that the drought will be broken by a tropical storm or hurricane. The first storm on the list in 2012 is Alberto again; let’s hope we get another Alberto this year that imitates the 2006 version of Alberto.

Patterns of rapid intensification
Peter Yaukey of the University of New Orleans studied patterns of hurricane rapid intensification in the Atlantic from 1950 – 2009. The Gulf of Mexico and Caribbean saw the most rapid intensification events, and the Northeast Atlantic the fewest. Interestingly, he found that rapid intensification events did not peak in September, but tended to be more common in June and July. Hurricane are less likely to intensify in the late afternoon and early evening (near 00 UTC), and more likely to intensify just after midnight, at 06 UTC.

Jeff Masters

from:    http://www.wunderground.com/blog/JeffMasters/comment.html?entrynum=2076

Dr. Jeff Masters on January Weather & Records

Posted by: JeffMasters, 2:25 PM GMT on February 08, 2012 +21
It wasn’t the warmest January in U.S. history, but it sure didn’t seem like winter last month–the contiguous U.S. experienced its fourth warmest January on record, and the winter period December 2011 – January 2012 was also the fourth warmest in the 117-year record, reported NOAA’s National Climatic Data Center yesterday. The percent area of the U.S. experiencing extremes in warm maximum temperatures was 56 percent–the second highest value on record. Thirteen of the 550 major U.S. cities with automated airport weather stations broke or tied all-time records for their hottest January temperature:

Craig, CO 82°F
Bakersfield, CA 82°F
Alexandria, LA 83°F
Duluth, MN 48°F
Minot, ND 61°F
Mitchell, SD 68°F
Fargo, ND 55°F
Jamestown, ND 56°F
Huron, SD 65°F
Aberdeen, SD 63°F
Iron Mountain, MI 52°F
Alma, GA 83°F
Omaha, NE 69°F

However, extremely cold air settled in over Alaska in January, and several cities in Alaska had their coldest average January temperatures on record: Nome (-16.6 degrees F), Bethel (-17.3 degrees F), McGrath (-28.5 degrees F), and Bettles (-35.6 degrees F).


Figure 1. State-by-state rankings of temperatures for January 2012. Nine states had top-ten warmest Januarys on record, while no states had below-average temperatures in January. Records go back to 1895. Image credit: NOAA’s National Climatic Data Center.

28th driest January for the contiguous U.S.
The first week of January was almost precipitation-free across the entire contiguous U.S., but a series of storms over Texas, the Ohio Valley, and the Pacific Northwest later in the month boosted precipitation totals enough to make January 2012 the 28th driest in the 118-year period of record. Remarkably, Texas had its 30th wettest January on record, and was the 2nd wettest state during the month. Texas also had a very wet December, their 19th wettest December. It is very rare for Texas to receive so much precipitation during a La Niña winter. Texas had not experienced two consecutive months with above-average precipitation since January – February 2010, during the last El Niño event.


Figure 2. State-by-state rankings of precipitation for January 2012. Three states had top-ten driest Januarys on record, while no states had a top-ten wettest January. Records go back to 1895. Image credit: NOAA’s National Climatic Data Center.

3rd least-snowy January
According to the Rutgers Global Snow Lab, the average U.S. snow extent during January was the 3rd smallest January snow cover extent in the 46-year period of record. The National Weather Service sends out a daily “Weather and Almanac” product for several hundred major U.S. cities that we make available on underground. The February 6 statistics for those cities that reported measurable snow this winter show that only fifteen cities in the lower 48 states reported above-average snowfall as of February 6, and 155 had received below-average snowfall.


Figure 3. The new “Blue Marble” image of Earth on January 4, 2012, as seen by the VIIRS instrument on the new Suomi NPP satellite. The U.S. and Canada are virtually snow-free and cloud-free, which is extremely rare for a January day. The lack of snow in the mountains of the Western U.S. is particularly unusual. I doubt one could find a January day this cloud-free with so little snow on the ground throughout the entire satellite record, going back to the early 1960s. NOAA’sAdvanced Hydrologic Prediction Service shows that only one state–Washington–had areas where precipitation accumulated more than 0.25″ on January 4, 2012, which is an extraordinary occurrence for a January day. Image credit:NASA.

Drought expands in January
According to the U.S. Drought Monitor, as of January 31st, 2012, about 3.3 percent of the contiguous U.S. was experiencing the worst category of drought–called D4 or exceptional drought–about the same as the beginning of the month. However, the percent area of the U.S. experiencing drought of any severity increased from 32 percent at the beginning of January to 38 percent at the end of the month. Most of the drought expansion occurred across the Upper Midwest and the western states.

2nd most January tornadoes on record
With 95 preliminary tornado reports, January 2012 is likely to end up with the 2nd most January tornadoes since 1950 (the record is 218, set in January 1999.)

from:    http://www.wunderground.com/blog/JeffMasters/comment.html?entrynum=2031